Note: This report is an updated version of one ITEP published in February of 2026, which examined the combined impact of tariffs and tax policy changes. This version expands the analysis to include all excess price increases (not just those due to tariffs) in addition to tax policy changes.
Download national and state-by-state data
The main policies of President Trump during his second term in office have had the net effect of raising taxes and costs in 2026 for the typical American in every income group except for the richest 1 percent.
Figure 1
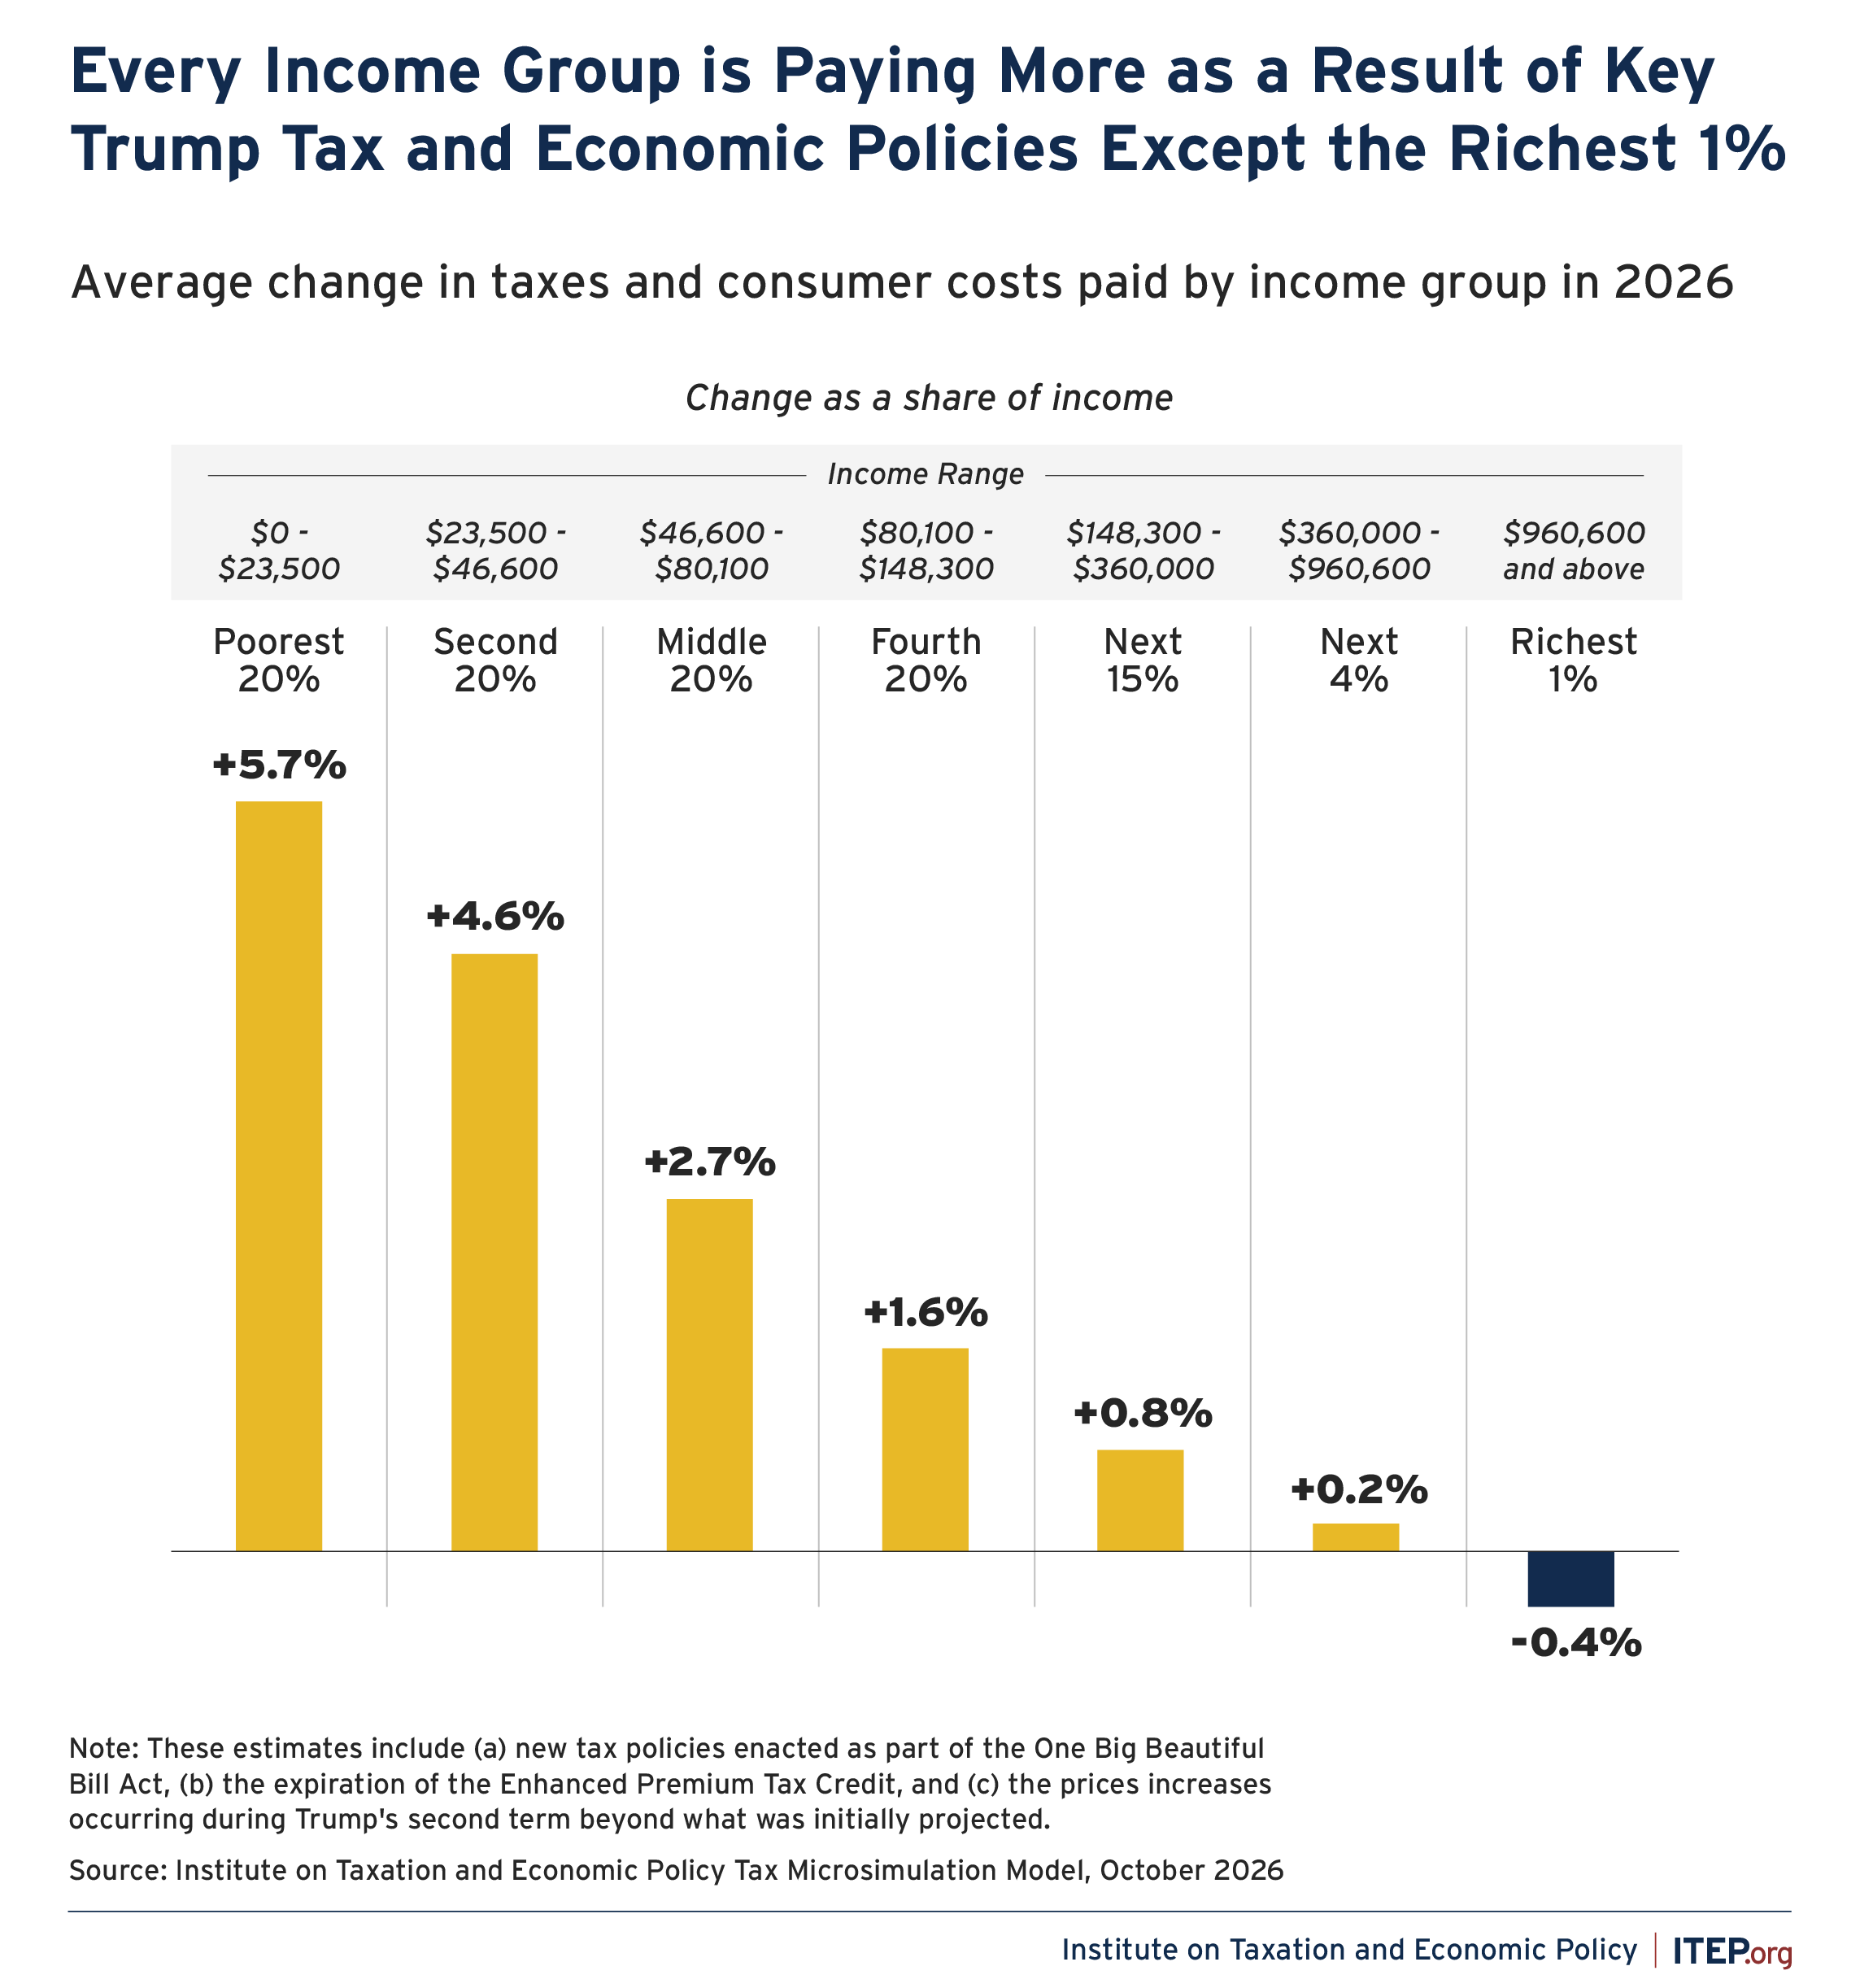
Figure 2
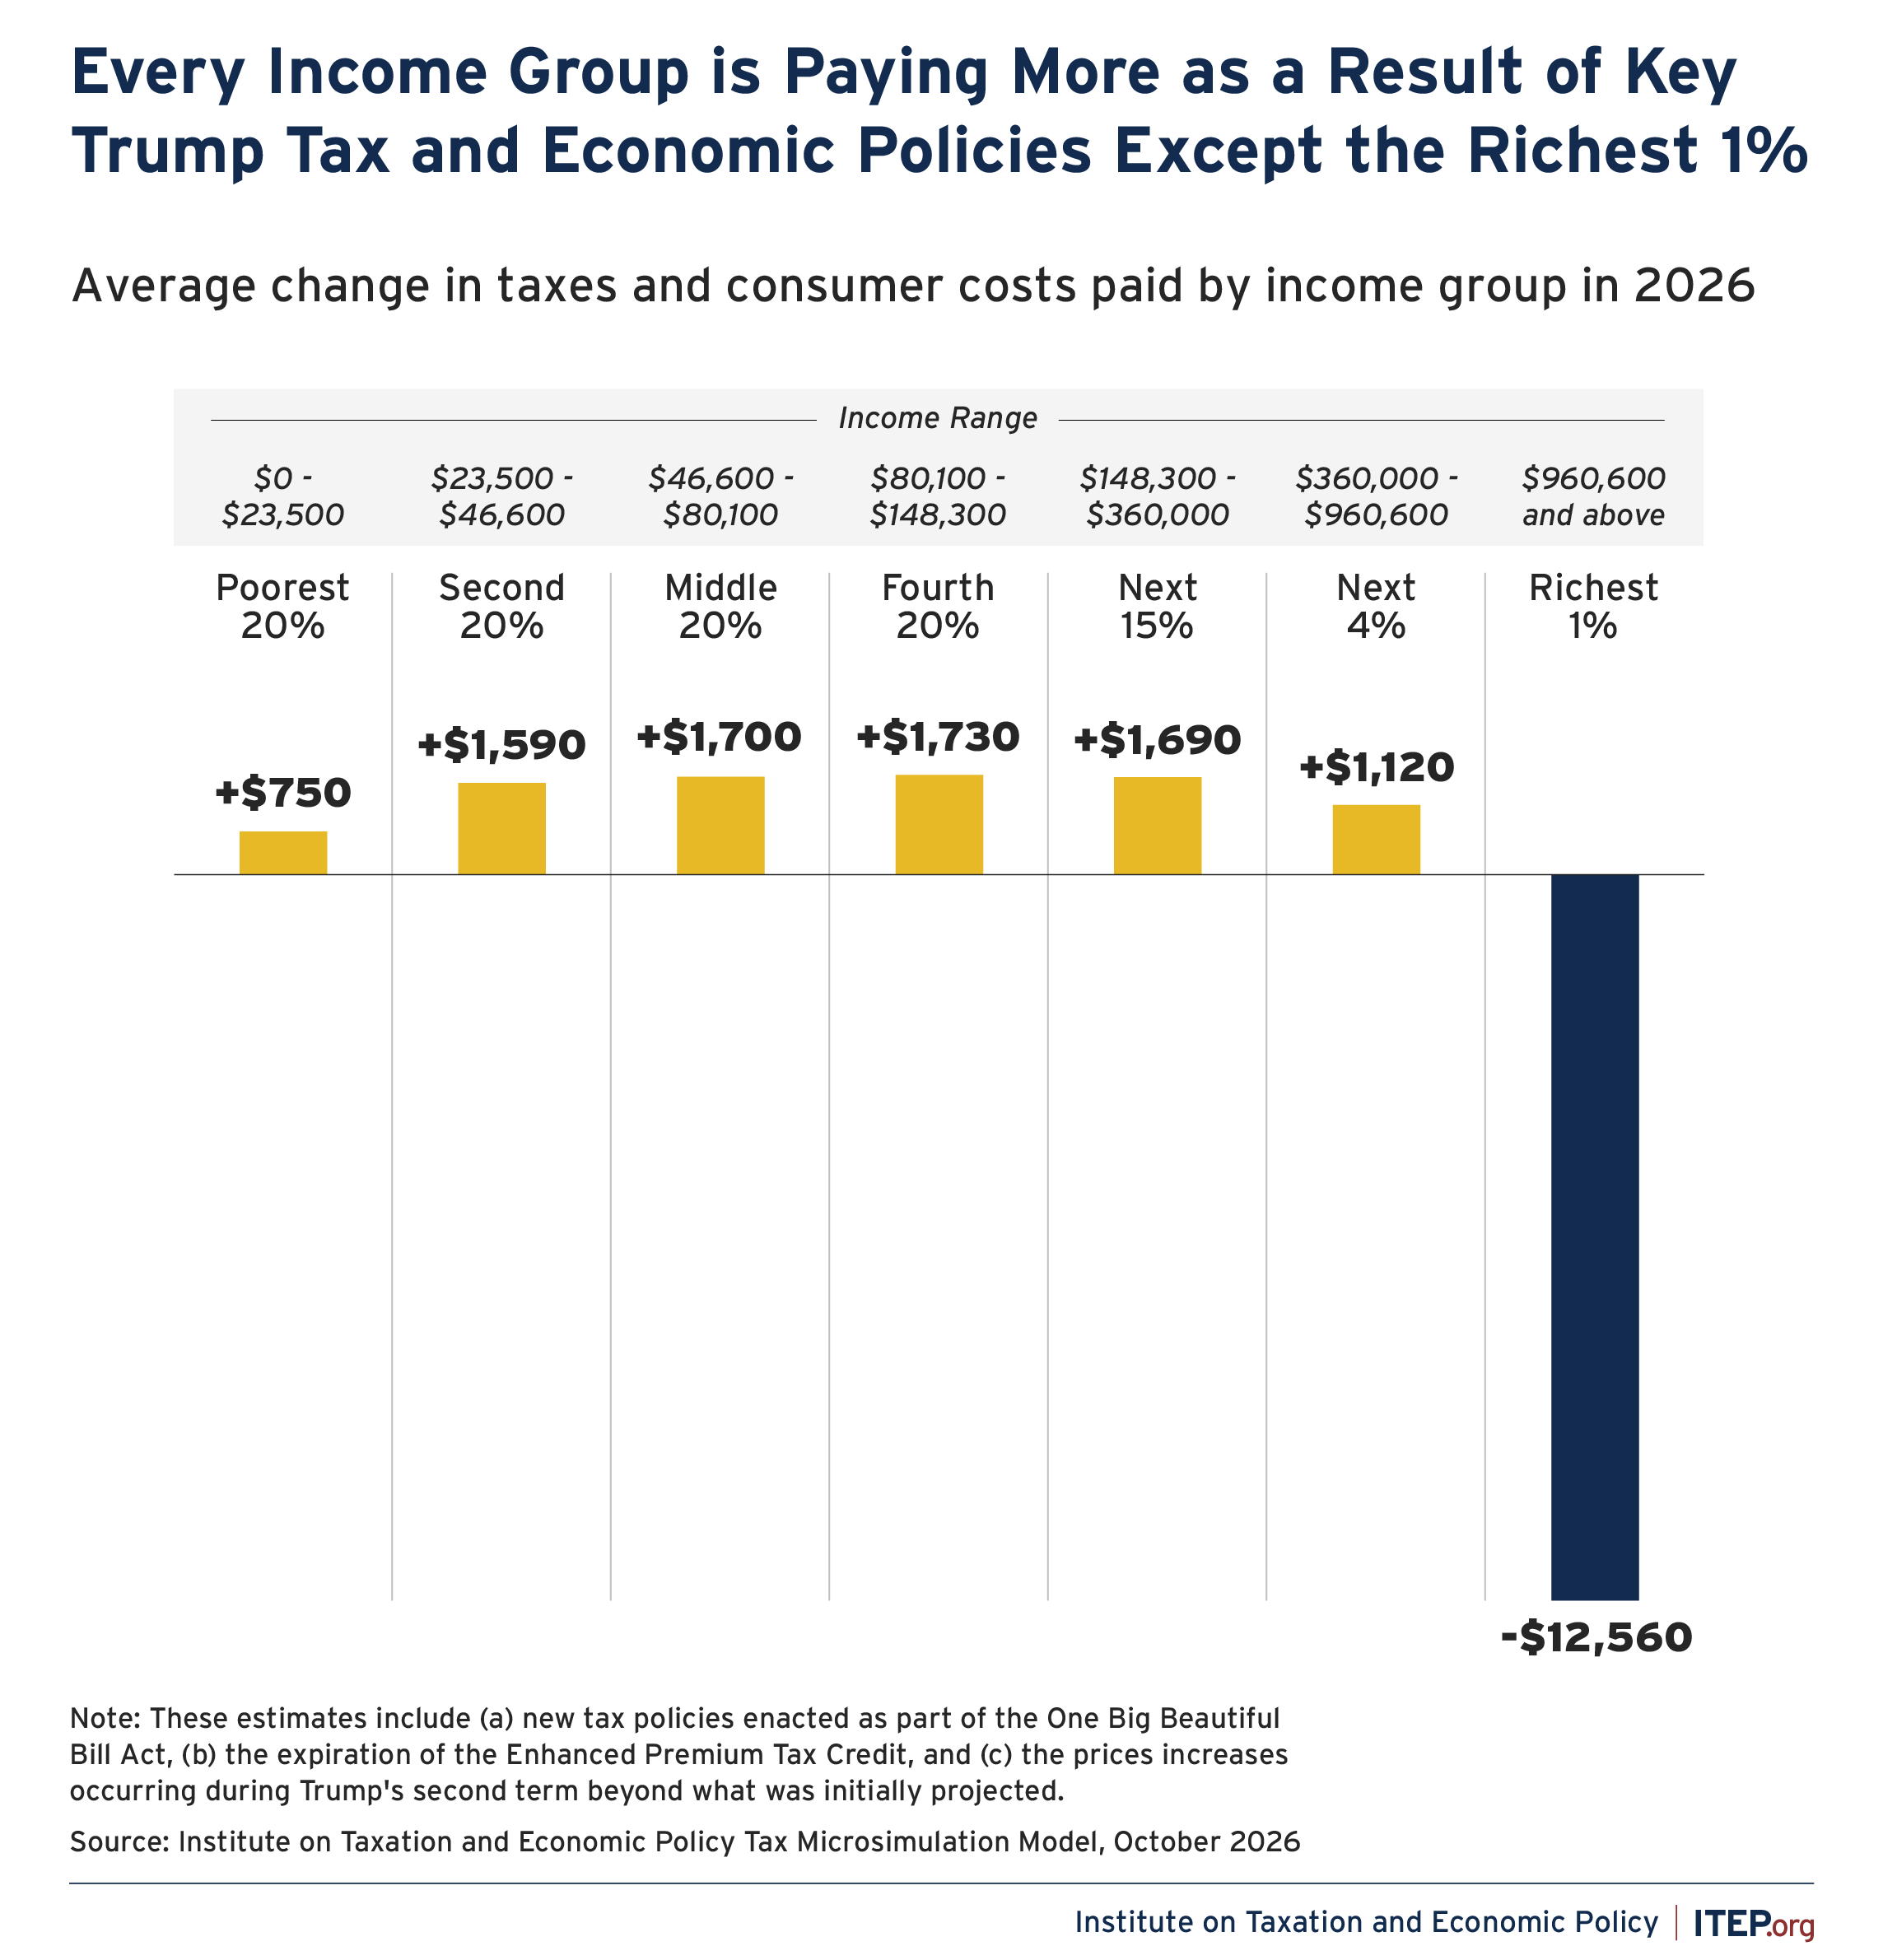
The figures here represent the impact of three kinds of policies from the Trump administration:
- New Tax Policies Enacted as Part of the so-called One Big Beautiful Bill Act (OBBBA). Signed into law in July 2025, OBBBA overwhelmingly benefits the rich and corporations. These figures include the effects of the law compared to what would have happened if Congress had simply extended the tax laws in place at the start of Trump’s second term.
- Policies Causing Excess Price Increases. These figures include the increase in inflation so far during Trump’s second term, which is measured as the difference between actual inflation during this period and inflation projected by the Congressional Budget Office when Trump returned to office. As explained further on, several policies of this administration are underpinning rising prices, including Trump’s tariffs, the effect of the Iran war on fuel prices, and Trump’s immigration policies.
- End of an Expanded Tax Credit for Health Care. President Trump and the Republican majority in Congress decided to allow the expiration of the Enhanced Premium Tax Credit (EPTC), which was enacted under former President Biden and had made health care more affordable for millions of people. Expiration of this policy resulted in a tax increase for these people. These figures include the impact on Americans compared to what would have happened if Congress had simply extended this policy that was already in place when Trump returned to the White House.
This does not include all costs imposed by Trump’s policies. For example, this analysis does not include the $1 trillion cut in Medicaid that is included in OBBBA or the $186 billion cut to food assistance.
The less income one has, the worse off they typically are under Trump’s policies. As shown in Figure 1, the net effect of these policies benefits the richest 1 percent of Americans but deals a tax and cost increase to the middle fifth of Americans equal to 2.7 percent of their income and an increase to the poorest fifth of Americans equal to 5.7 percent of their income.
This is happening because, for most Americans, any tax cut they received under Trump’s 2025 tax law (OBBBA) is more than offset by the price increases and, in many cases, by the loss of the expanded health care tax credit. The exception is the richest 1 percent of Americans, who benefit overall. This is illustrated in Figures 3 and 4.
Figure 3
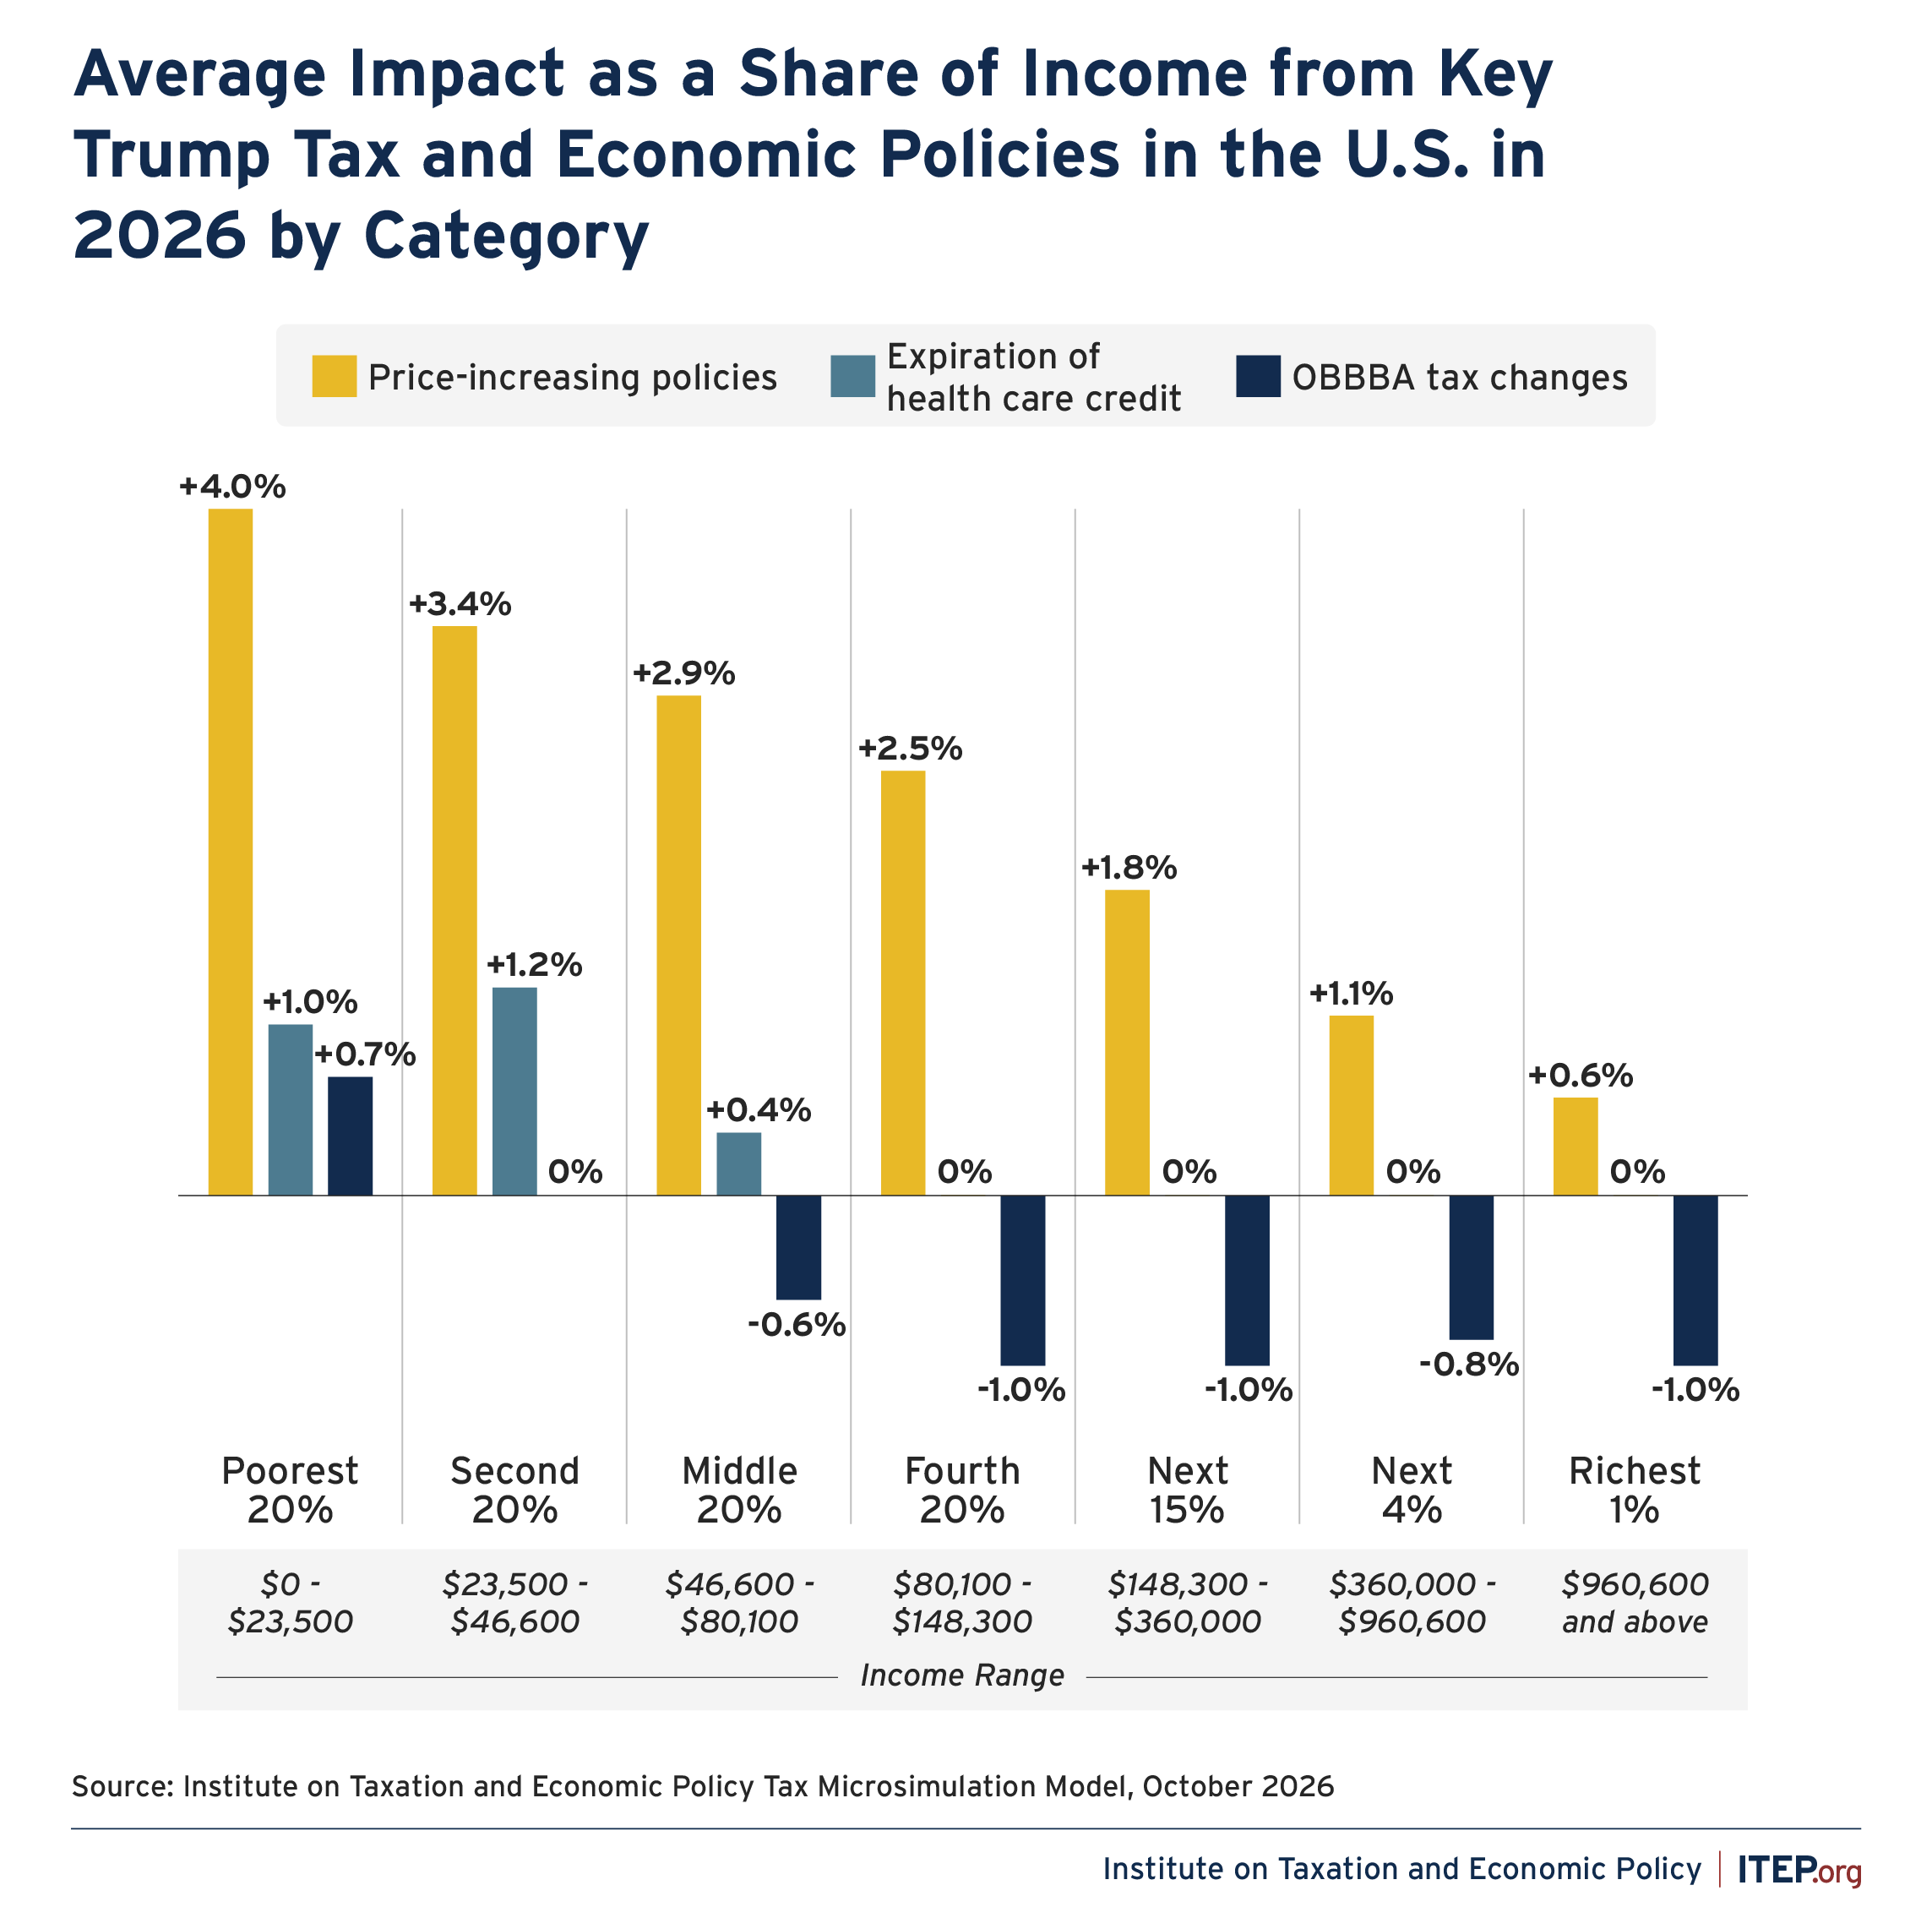
Figure 4
More Details About Trump’s Tax and Price-Increasing Policies
New Tax Policies Enacted as Part of the One Big Beautiful Bill Act (OBBBA)
- While proponents of OBBBA often describe certain portions of the law that they argue benefit the middle class (such as tax breaks for tips and overtime) these provisions are a very small portion of the overall legislation which overwhelmingly benefits high-income people and corporations.
- Since the 2025 law was enacted, enormous profitable corporations like Meta, Amazon, Google, Tesla, and many others have paid extremely low effective tax rates (from 0 percent to 8 percent) in large part due to OBBBA.
- Tax breaks provided under OBBBA are currently subsidizing AI data centers that are opposed by the vast majority of Americans.
The Republican Congress’ Decision to End the Enhanced Premium Tax Credit (EPTC)
- The EPTC was an expanded version of an existing tax credit that helps individuals pay premiums on health insurance they obtain through the Affordable Care Act Marketplace. The EPTC was enacted in 2021 and the next year it was extended through 2025. Republicans in Congress chose to not extend it even as they extended the provisions of the Trump tax cuts from his first term.
- The number of people enrolled in Affordable Care Act marketplaces dropped by 3 million people since the credit expired, and premiums surged for many who remained enrolled.
Trump’s Price-Increasing Policies
The price increases included in this analysis consist of the difference between what observed inflation has been so far in Trump’s second term and what the Congressional Budget Office projected it would be shortly before the term began.
There are at least three types of policies that largely explain this additional inflation Americans have experienced since Trump returned to the White House.
- Trump’s tariffs, which are taxes on imports. In theory, tariffs could be a small part of a broader set of tools used to address narrow problems in trade policy, but that is far from how the Trump administration is using tariffs. While President Trump claims that foreigners pay the tariffs, the claim is not taken seriously by independent analysts. Even U.S. corporations admit Americans are paying them.
- Trump’s war in Iran, which has caused fuel prices to surge. The increased gas and diesel prices caused by the war have cost Americans over $100 billion so far.
- Trump’s immigration policies. The loss of foreign-born workers has caused supply problems in key industries such as agriculture and construction. This has led to higher prices for food, housing and other goods and services.
Appendix
Why Proponents of Trump’s Policies Say They Provide Large Tax Cuts to Everyone
The figures presented in this report up to this point are the best possible illustrations of how Americans likely feel the impact of federal policy changes since Trump returned to the White House. However, President Trump and Congressional Republicans talk about the effects of these policies in a very different way.
To the extent that they cite data at all, they usually refer to estimates that:
- Do not include the excess price increases that have occurred in Trump’s second term. This leaves out the most fundamental aspect of how Americans are feeling about the economy and about their own financial situations right now.
- Do not include the termination of the EPTC (the expanded health insurance tax credit). This leaves out the policy change that ended health insurance for millions of Americans and made it more difficult to afford for millions more.
- Define tax changes in the 2025 tax law (OBBBA) to include both the extension of previously enacted tax policies (which is not included in the figures in this report up to this point) as well as enactment of new ones (which is included in the figures above). This makes OBBBA appear to provide larger tax cuts to most Americans than they experienced because this approach includes mere continuations of tax policies that were already in effect during the year OBBBA was enacted.
In other words, proponents of OBBBA may often describe the impacts of its tax changes compared to what was (at the time OBBBA was being drafted) current law. Under current law at that time, many of the tax changes that Trump signed into law during his first term (in 2017) would have expired at the end of 2025. OBBBA made most of those tax changes permanent, as well as providing many new ones.
Figure 5 shows the approach used in the main body of this report while Figure 6 shows the approach used by proponents of Trump’s policies. Both approaches include new tax policies enacted as part of OBBBA.
As illustrated in Figure 5, the approach used in this report also includes the effect of price-increasing policies and the effects of the expiration of the expanded health care credit.
As illustrated in Figure 6, the approach often used by proponents of Trump’s policies includes just the new tax policies enacted as part of OBBBA and OBBBA’s extensions of previously existing tax policies.
Figure 5
Figure 6
Presenting OBBBA’s tax changes compared to what was then current law, and excluding the effects of other policies, makes it look as though Trump’s policies simply gave tax cuts to most Americans. But even this approach, which OBBBA’s proponents believe presents the tax law in the most favorable light possible, demonstrates that it was written to benefit the well-off far more than anyone else.
As illustrated in Figure 6, the average tax change for the richest one percent under OBBBA is more than $70,000 for this year alone. For the poorest fifth of Americans, the average tax change from OBBBA is a small tax increase (occurring largely because of restrictions the law placed on certain tax credits).
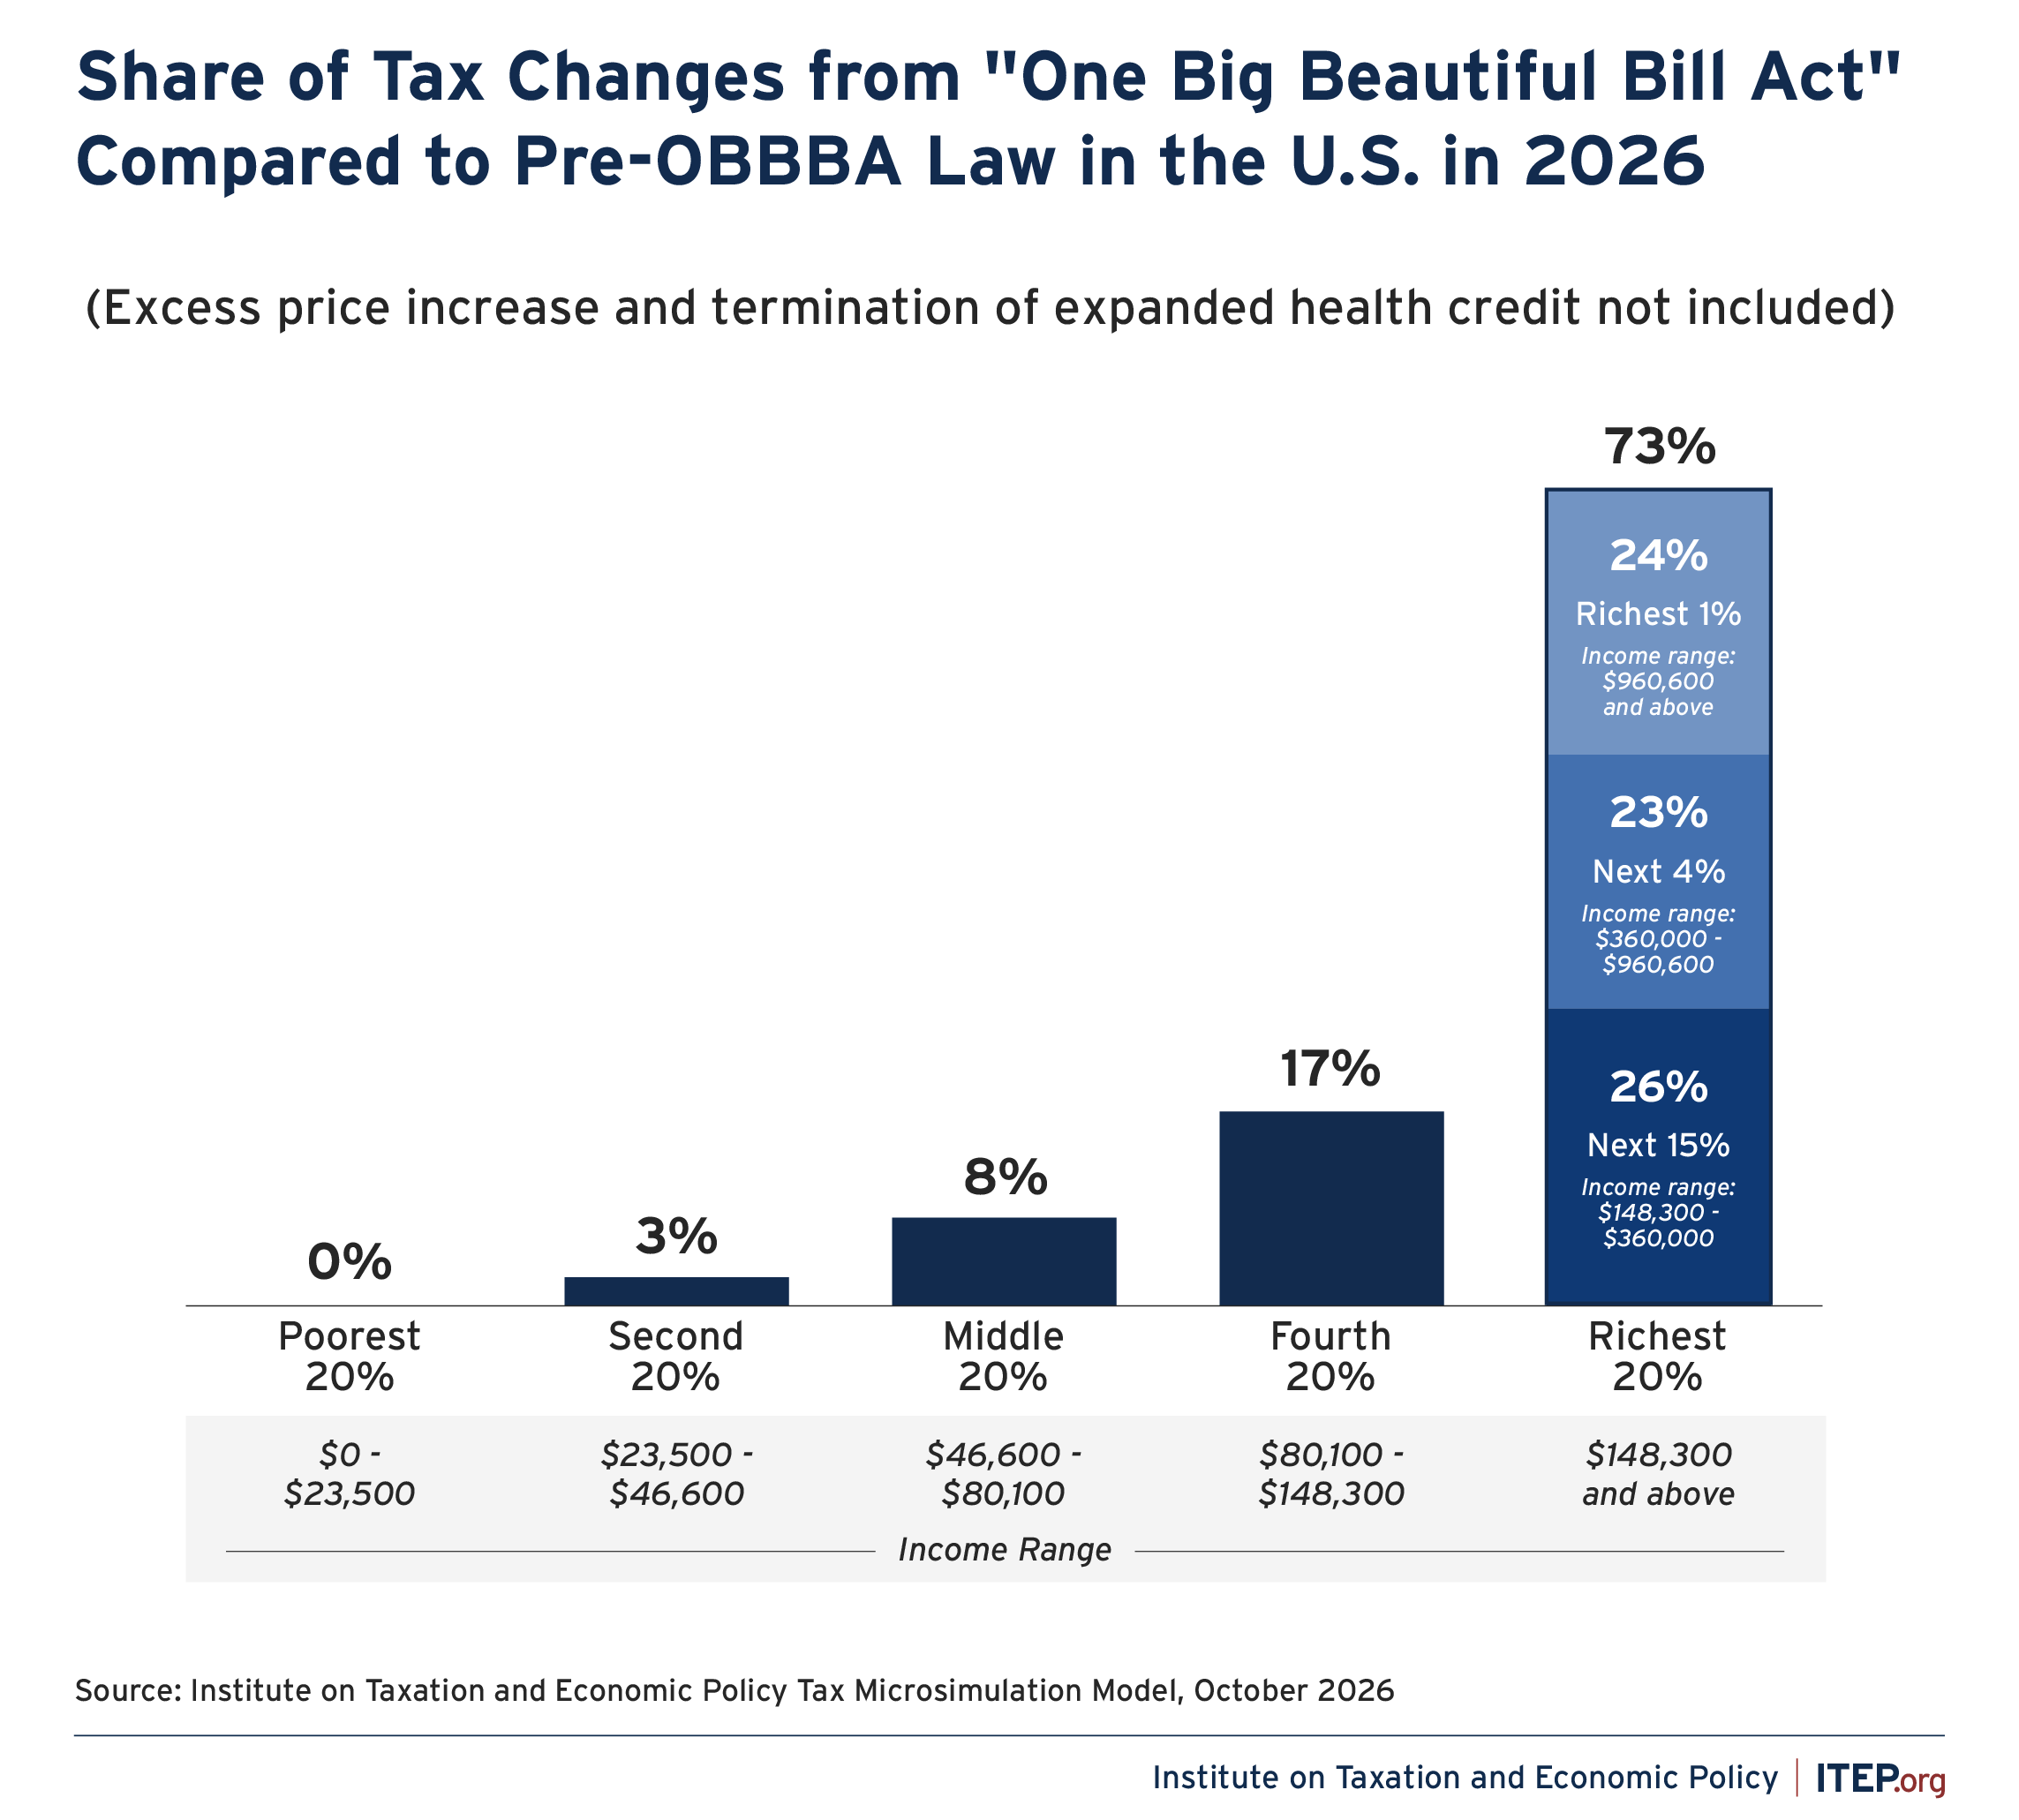
Certain parts of OBBBA are particularly beneficial to the richest taxpayers. Figure 7 below breaks down the average tax changes from OBBBA (compared to what was current law) into different categories and illustrates that some are particularly helpful to the richest one percent.
Figure 7
- Changes in tax rates and brackets will cut taxes for the richest 1 percent by an average of $29,000 in 2026.
- The extension of the pass-through deduction (section 199A) for business owners will reduce taxes for the top 1 percent by an average of more than $22,000 next year.
- A collection of business tax changes affecting corporations and other businesses will cut taxes by an average of nearly $37,000 next year for the top 1 percent.
As a result, the tax changes compared to pre-OBBBA law (the perspective that OBBBA’s proponents believe is most flattering for the law) are heavily skewed in favor of the well-off. In 2026, the richest fifth of Americans will receive 73 percent of the benefits, while the middle fifth of Americans will receive just 8 percent of the benefits and the poorest fifth will receive nothing. The richest 1 percent alone will receive nearly a fourth of the total benefits this year.
Figure 8