Recent Work
2178 items
State Rundown 6/13: Decisions are falling into place, but some states will come back for more
June 13, 2024 • By ITEP Staff
State budgets are falling into place as lawmakers near the end of their legislative sessions...
This week, it was the best of times or, in some cases, the worst of times for tax policy in two different states...
Legislative sessions across the country are still very much in for summer, which means more pencils, more budgets, and more tax plans...
States Should Opt Into IRS Direct File as the Program is Made Permanent
May 30, 2024 • By Jon Whiten
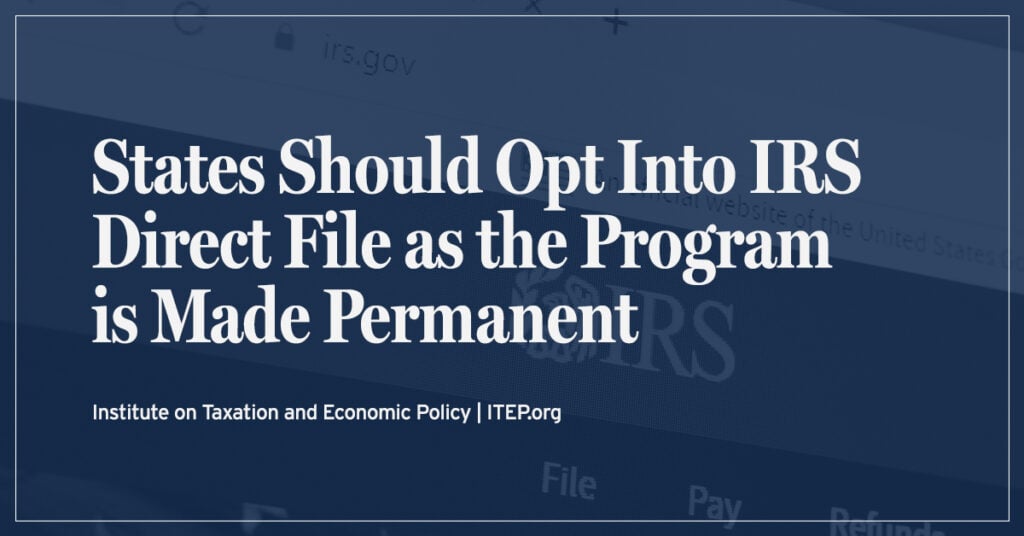
While there is plenty of room to expand Direct File at the federal level, states can take matters into their own hands and bring this benefit to their residents by opting into the program.
State Rundown 5/22: When One Legislative Session Closes, Another Opens
May 22, 2024 • By ITEP Staff
State legislatures are wrapping up, but don’t stray too far from your state capital or you’ll miss out on the action...

There are a variety of factors that affect teacher pay. But one often overlooked factor is progressive tax policies that allow states to raise and provide the funding educators and their students deserve.
Uncertainty abounds in state tax debates lately...
This week, special sessions with major tax implications are in the air...
Iowa Flat Tax Shows Why Such Policies Are a Problem Everywhere
May 9, 2024 • By Eli Byerly-Duke

As Iowa lawmakers change the state’s graduated personal income tax to a single flat rate, they are designing a state tax code where the rich will pay a lower rate overall than families with modest means.
This week, many states took steps toward enacting tax cuts...
Corporate Taxes Before and After the Trump Tax Law
May 2, 2024 • By Matthew Gardner, Michael Ettlinger, Spandan Marasini, Steve Wamhoff
The Trump tax law slashed taxes for America’s largest, consistently profitable corporations. These companies saw their effective tax rates fall from an average of 22.0 percent to an average of 12.8 percent after the Trump tax law went into effect in 2018.
Increased information transfer from the IRS would improve the quality of data at the Census Bureau and expand opportunities for tax policy research. This is critical for researchers who rely on Census Bureau data and products to fill the informational gaps present in tax data.
Many state legislative sessions are wrapping up...
Tax History Matters: A Q&A with Professor Andrew Kahrl, Author of ‘The Black Tax’
April 24, 2024 • By Brakeyshia Samms
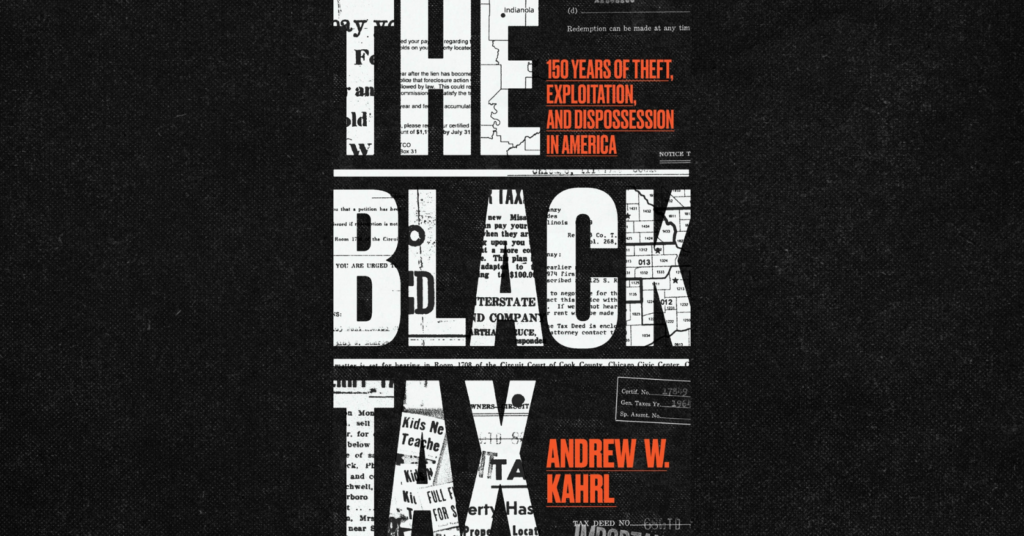
In his new book, The Black Tax: 150 Years of Theft, Exploitation, and Dispossession in America, Professor Andrew Kahrl walks readers through the history of the property tax system and its structural defects that have led to widespread discrimination against Black Americans.
TurboTax Maker Puts a Pink Spin on Exploitative Financial Products
April 22, 2024 • By Amy Hanauer
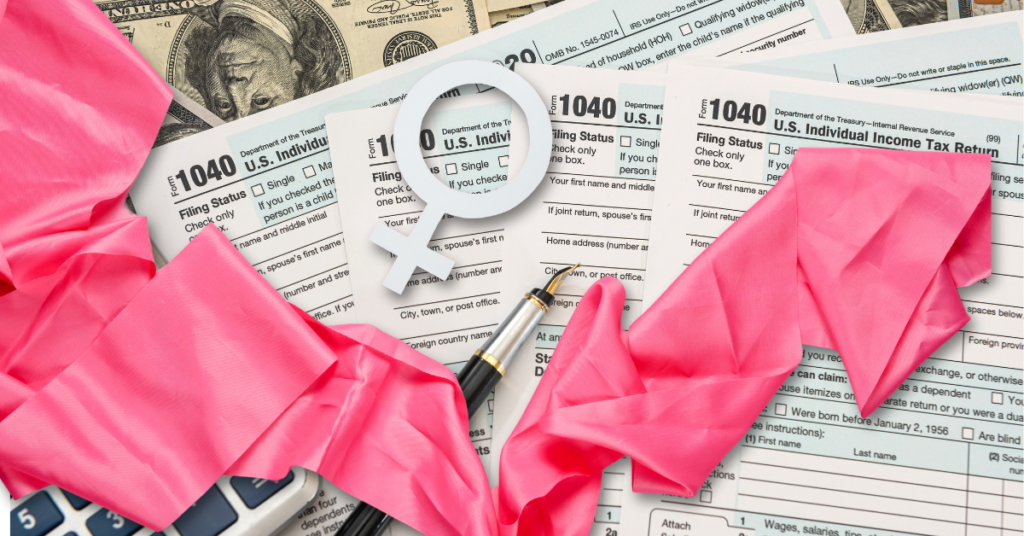
This op-ed originally appeared in MSNBC Tax preparation behemoth Intuit (maker of TurboTax) recently unveiled a new campaign branding itself as a feminist company. “When it comes to the complexities of the tax code, women encounter distinct challenges,” reads a post on the company’s official blog, “and here at Intuit, we’re committed to empowering prosperity for […]

Institute on Taxation
and Economic Policy
ITEP is a non-profit, non-partisan tax policy organization. We conduct rigorous analyses of tax and economic proposals and provide data-driven recommendations to shape equitable and sustainable tax systems.
Subscribe to ITEP Emails
Tax research and policy news in your inbox.
Promote Fair Tax Policy
Your gift to ITEP promotes tax justice. With your help, we do research that supports taxing millionaires and billionaires, taxing big corporations and raising revenue for the things our people, our communities and our planet need.
Together, we can create a country with more economic justice, more racial justice, more climate justice… and more tax justice.