Who Pays?
Virginia: Who Pays? 6th Edition
October 17, 2018 • By ITEP Staff
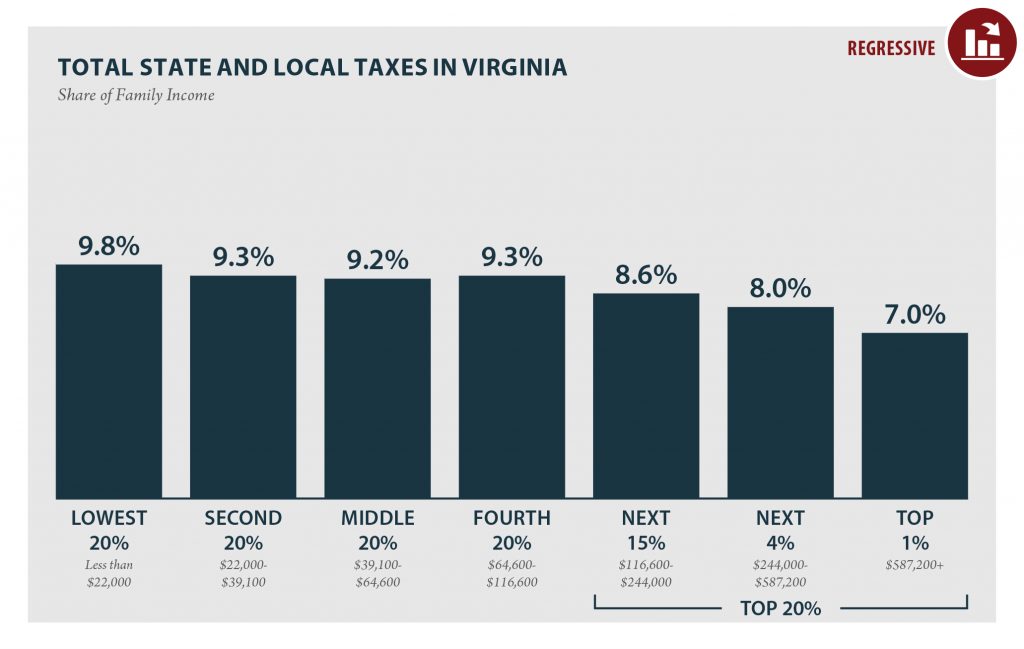
VIRGINIA Read as PDF VIRGINIA STATE AND LOCAL TAXES Taxes as Share of Family Income Top 20% Income Group Lowest 20% Second 20% Middle 20% Fourth 20% Next 15% Next 4% Top 1% Income Range Less than $22,000 $22,000 to $39,100 $39,100 to $64,600 $64,600 to $116,600 $116,600 to $244,000 $244,000 to $587,200 over $587,200 […]
North Carolina: Who Pays? 6th Edition
October 17, 2018 • By ITEP Staff
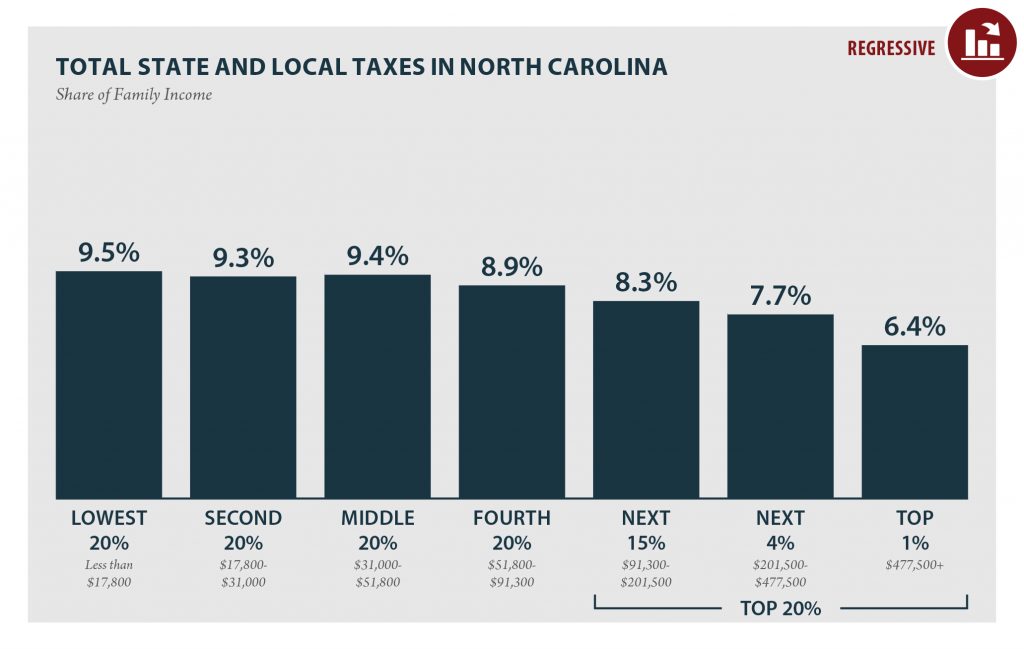
NORTH CAROLINA Read as PDF NORTH CAROLINA STATE AND LOCAL TAXES Taxes as Share of Family Income Top 20% Income Group Lowest 20% Second 20% Middle 20% Fourth 20% Next 15% Next 4% Top 1% Income Range Less than $17,800 $17,800 to $31,000 $31,000 to $51,800 $51,800 to $91,300 $91,300 to $201,500 $201,500 to $477,500 […]
New Mexico: Who Pays? 6th Edition
October 17, 2018 • By ITEP Staff
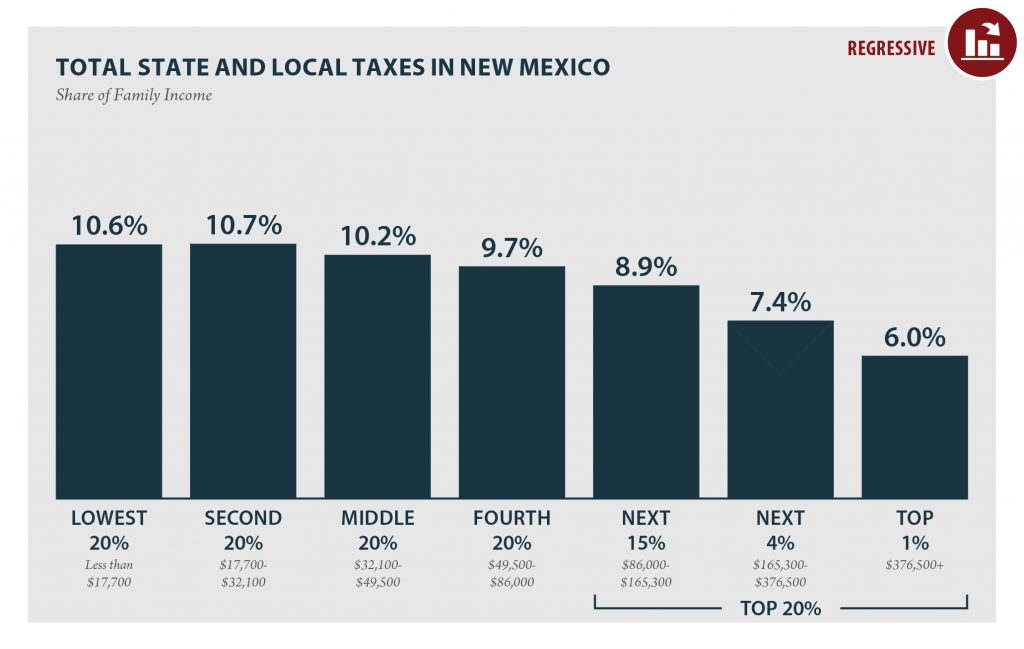
NEW MEXICO Read as PDF NEW MEXICO STATE AND LOCAL TAXES Taxes as Share of Family Income Top 20% Income Group Lowest 20% Second 20% Middle 20% Fourth 20% Next 15% Next 4% Top 1% Income Range Less than $17,700 $17,700 to $32,100 $32,100 to $49,500 $49,500 to $86,000 $86,000 to $165,300 $165,300 to $376,500 […]
Alaska: Who Pays? 6th Edition
October 17, 2018 • By ITEP Staff
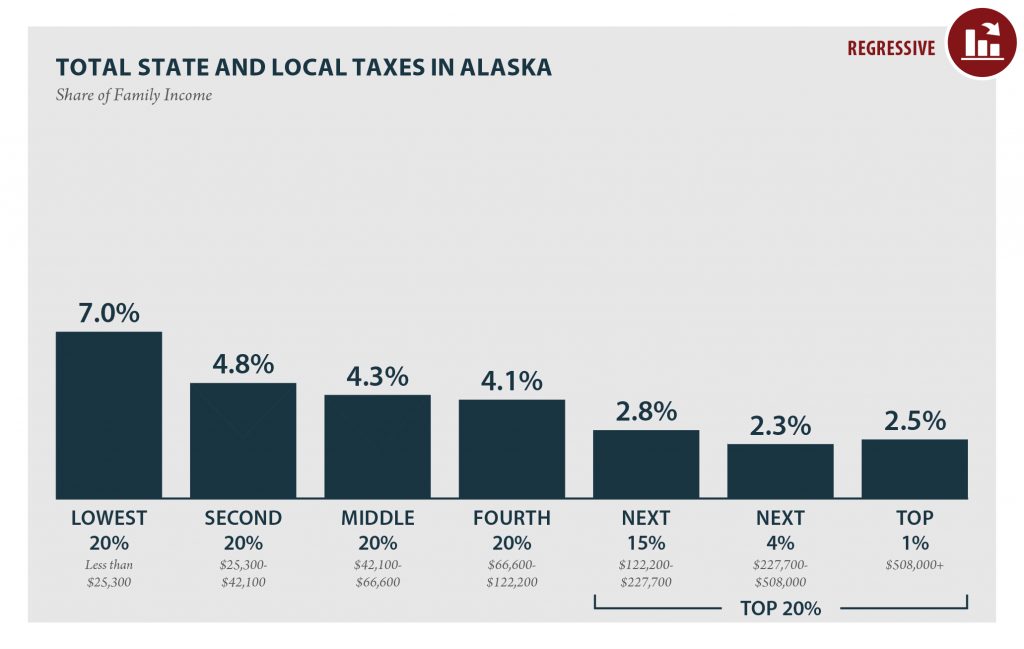
ALASKA Read as PDF ALASKA STATE AND LOCAL TAXES Taxes as Share of Family Income Top 20% Income Group Lowest 20% Second 20% Middle 20% Fourth 20% Next 15% Next 4% Top 1% Income Range Less than $25,300 $25,300 to $42,100 $42,100 to $66,600 $66,600 to $122,200 $122,200 to $227,700 $227,700 to $508,000 over $508,000 […]
California: Who Pays? 6th Edition
October 17, 2018 • By ITEP Staff
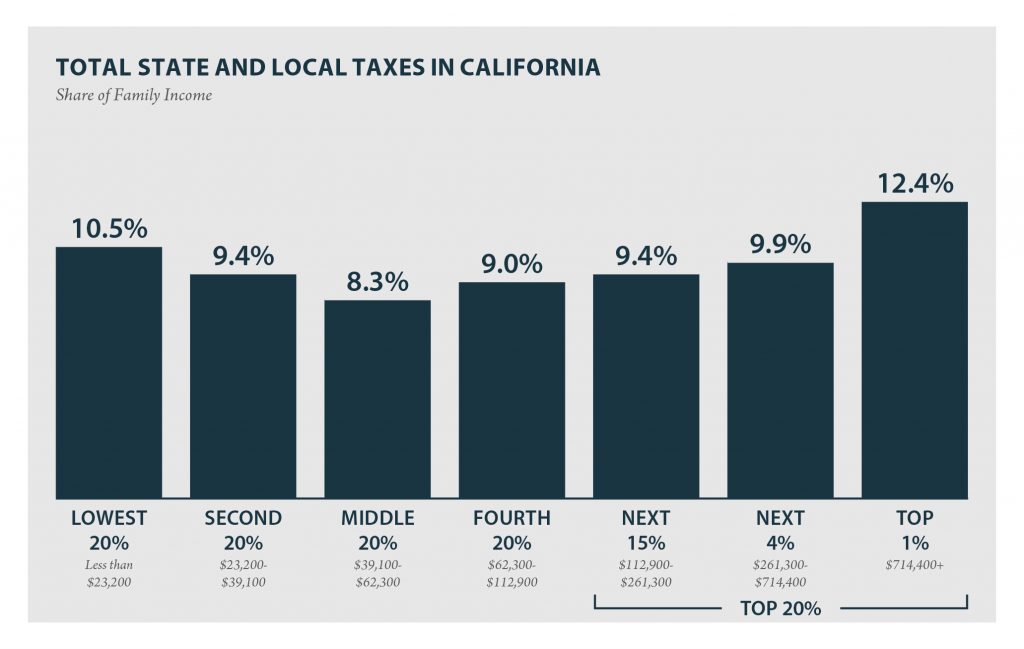
CALIFORNIA Read as PDF CALIFORNIA STATE AND LOCAL TAXES Taxes as Share of Family Income Top 20% Income Group Lowest 20% Second 20% Middle 20% Fourth 20% Next 15% Next 4% Top 1% Income Range Less than $23,200 $23,200 to $39,100 $39,100 to $62,300 $62,300 to $112,900 $112,900 to $261,300 $261,300 to $714,400 over $714,400 […]
Vermont: Who Pays? 6th Edition
October 17, 2018 • By ITEP Staff
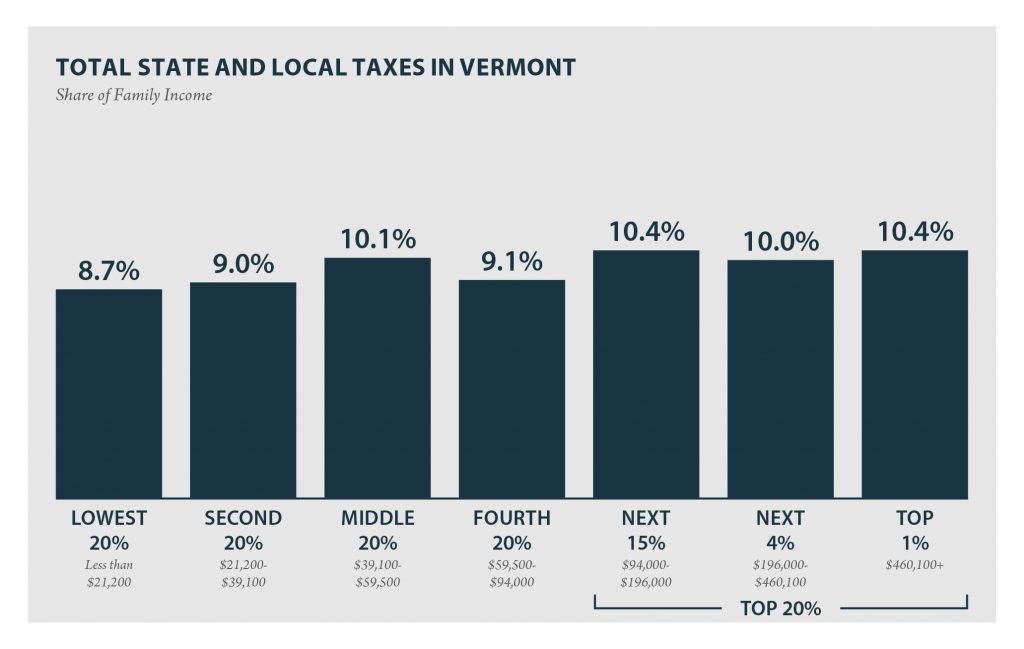
VERMONT Read as PDF VERMONT STATE AND LOCAL TAXES Taxes as Share of Family Income Top 20% Income Group Lowest 20% Second 20% Middle 20% Fourth 20% Next 15% Next 4% Top 1% Income Range Less than $21,200 $21,200 to $39,100 $39,100 to $59,500 $59,500 to $94,000 $94,000 to $196,000 $196,000 to $460,100 over $460,100 […]
Hawaii: Who Pays? 6th Edition
October 17, 2018 • By ITEP Staff
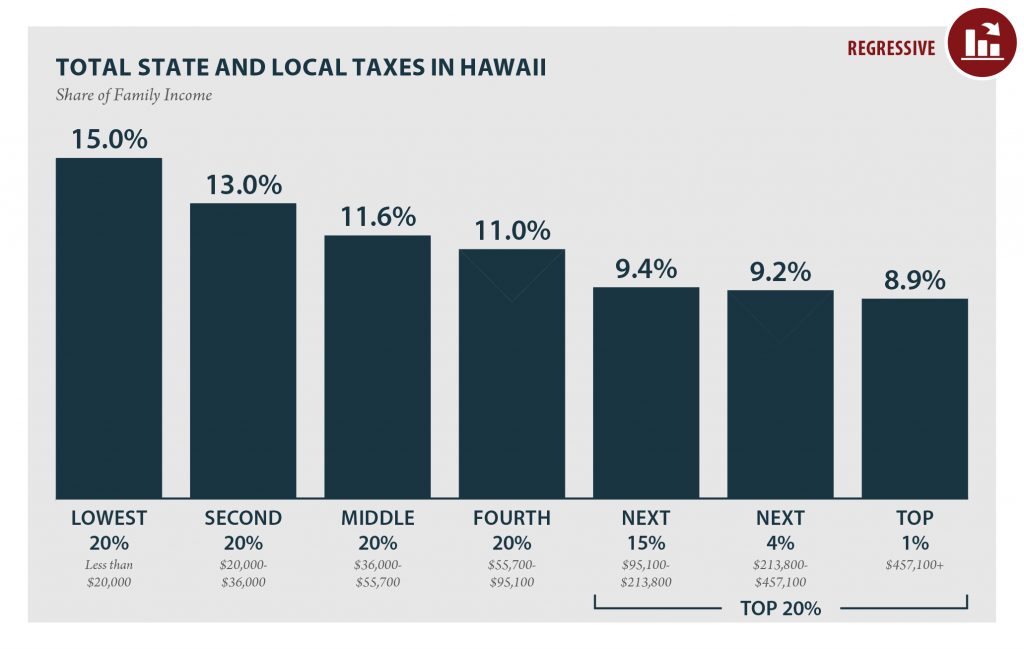
HAWAII Read as PDF HAWAII STATE AND LOCAL TAXES Taxes as Share of Family Income Top 20% Income Group Lowest 20% Second 20% Middle 20% Fourth 20% Next 15% Next 4% Top 1% Income Range Less than $20,000 $20,000 to $36,000 $36,000 to $55,700 $55,700 to $95,100 $95,100 to $213,800 $213,800 to $457,100 over $457,100 […]
Kentucky: Who Pays? 6th Edition
October 17, 2018 • By ITEP Staff
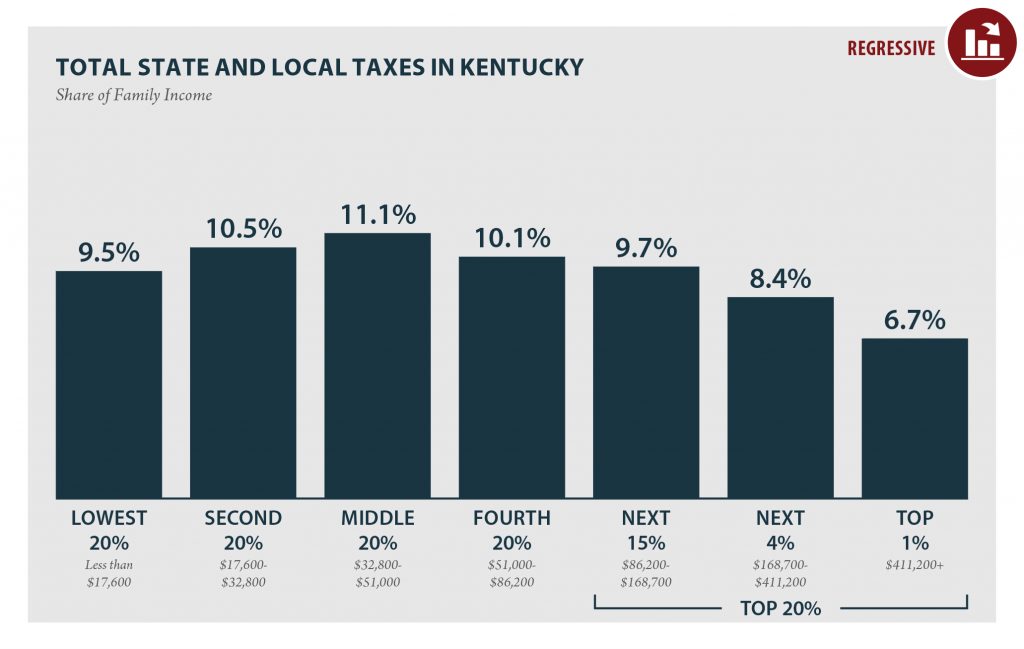
According to ITEP’s Tax Inequality Index, which measures the impact of each state’s tax system on income inequality, Kentucky has the 25th most unfair state and local tax system in the country. Incomes are more unequal in Kentucky after state and local taxes are collected than before.
Oregon: Who Pays? 6th Edition
October 17, 2018 • By ITEP Staff
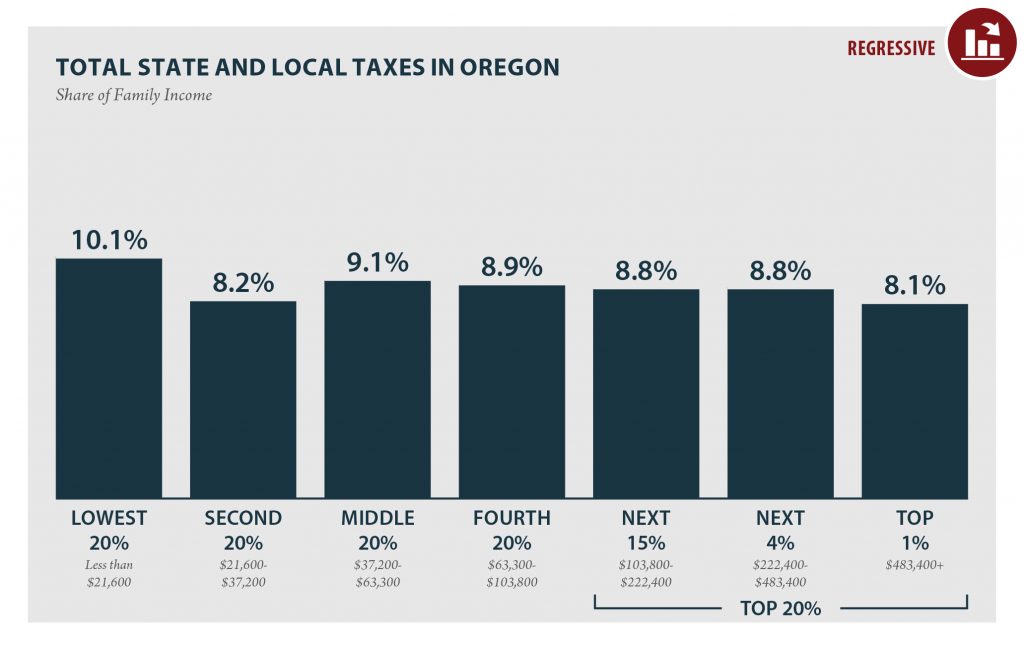
OREGON Read as PDF OREGON STATE AND LOCAL TAXES Taxes as Share of Family Income Top 20% Income Group Lowest 20% Second 20% Middle 20% Fourth 20% Next 15% Next 4% Top 1% Income Range Less than $21,600 $21,600 to $37,200 $37,200 to $63,300 $63,300 to $103,800 $103,800 to $222,400 $222,400 to $483,400 over $483,400 […]
Ohio: Who Pays? 6th Edition
October 17, 2018 • By ITEP Staff
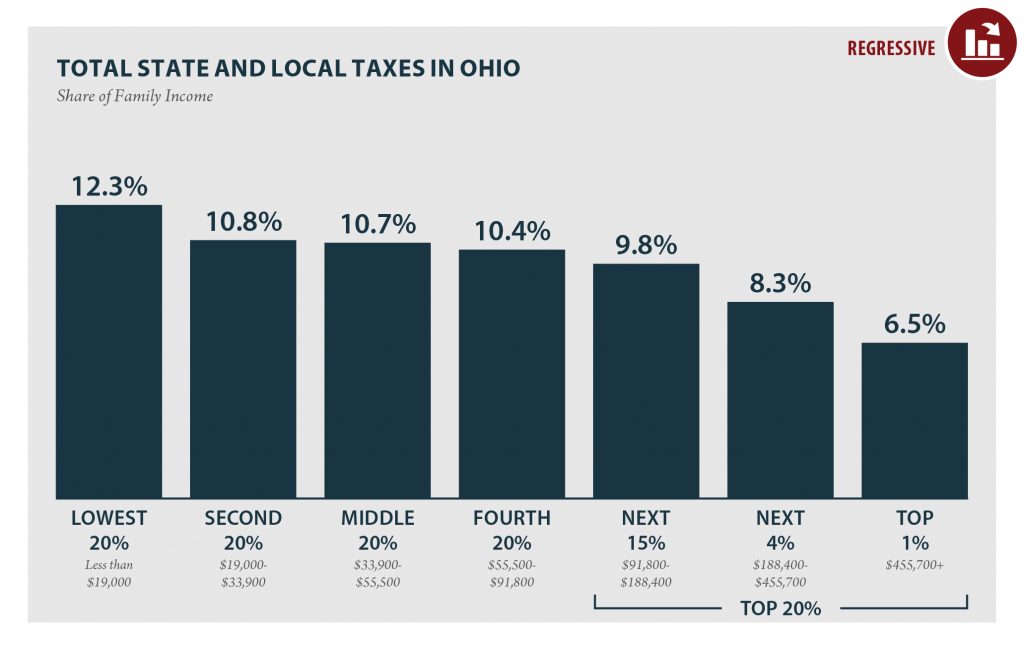
OHIO Read as PDF OHIO STATE AND LOCAL TAXES Taxes as Share of Family Income Top 20% Income Group Lowest 20% Second 20% Middle 20% Fourth 20% Next 15% Next 4% Top 1% Income Range Less than $19,000 $19,000 to $33,900 $33,900 to $55,500 $55,500 to $91,800 $91,800 to $188,400 $188,400 to $455,700 over $455,700 […]
Montana: Who Pays? 6th Edition
October 17, 2018 • By ITEP Staff
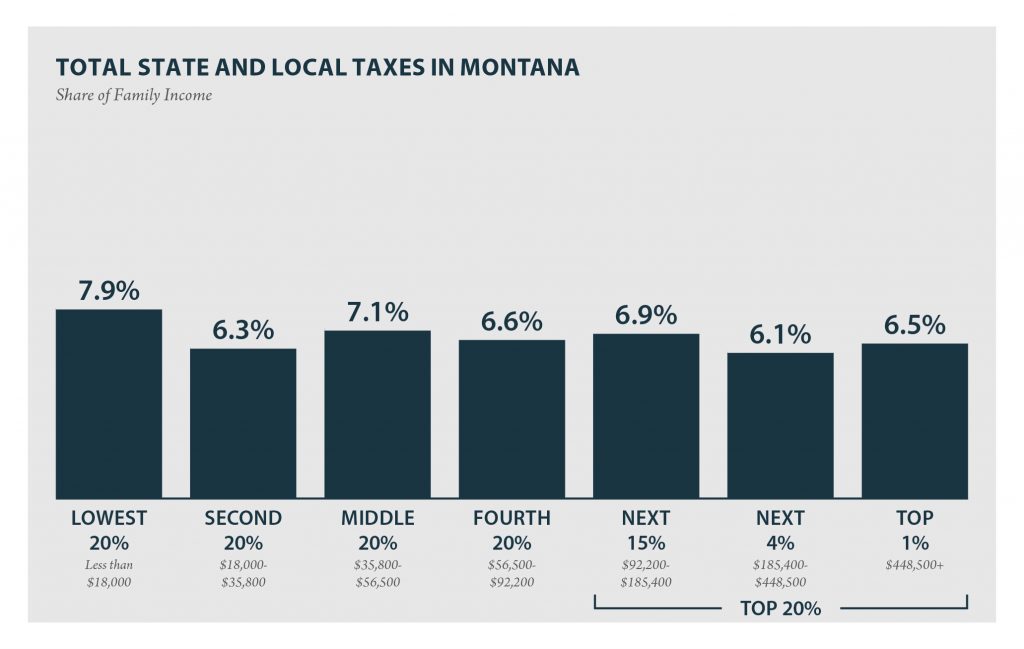
According to ITEP’s Tax Inequality Index, Montana’s state and local tax system does not worsen income inequality and ranks 43rd on the index. The large income gap between lower- and middle-income taxpayers, as compared to the wealthy, is somewhat narrower after state and local taxes than before.
Maine: Who Pays? 6th Edition
October 17, 2018 • By ITEP Staff
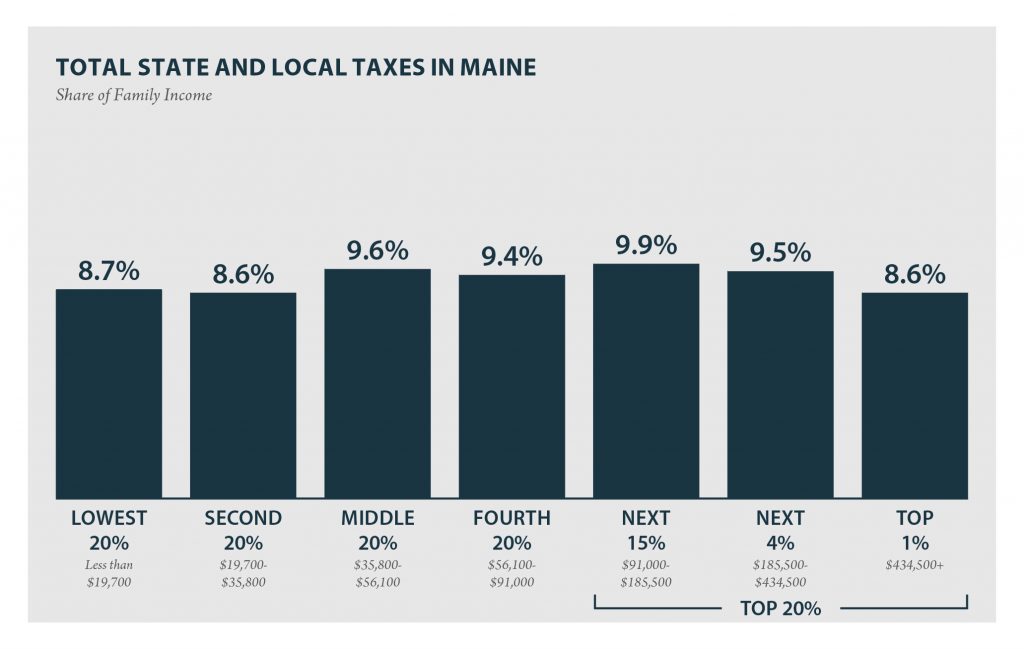
MAINE Read as PDF MAINE STATE AND LOCAL TAXES Taxes as Share of Family Income Top 20% Income Group Lowest 20% Second 20% Middle 20% Fourth 20% Next 15% Next 4% Top 1% Income Range Less than $19,700 $19,700 to $35,800 $35,800 to $56,100 $56,100 to $91,000 $91,000 to $185,500 $185,500 to $434,500 over $434,500 […]
South Carolina: Who Pays? 6th Edition
October 17, 2018 • By ITEP Staff
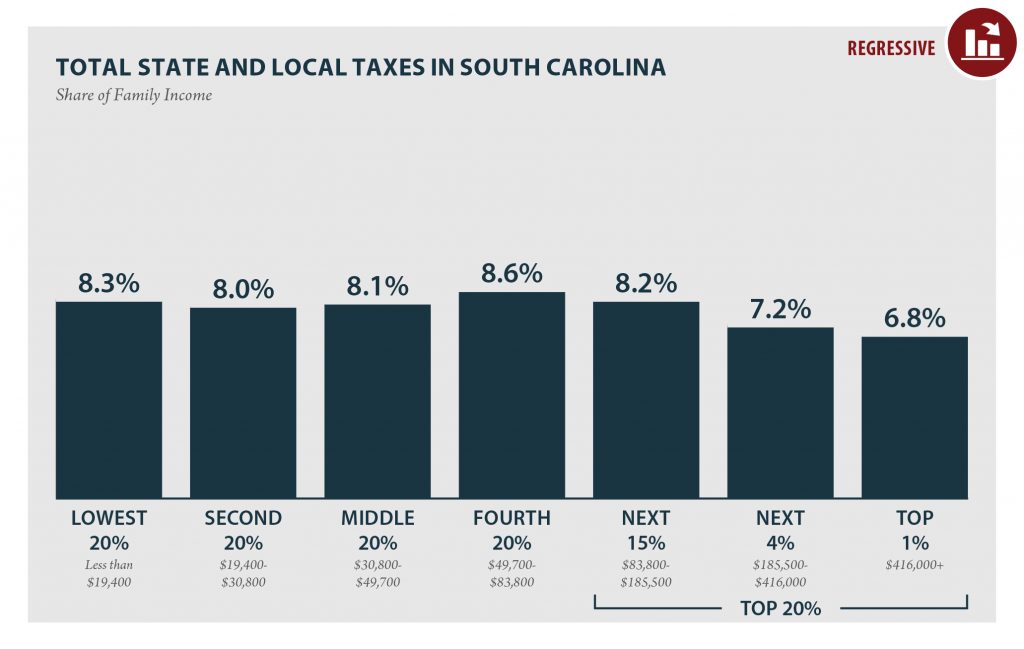
SOUTH CAROLINA Read as PDF SOUTH CAROLINA STATE AND LOCAL TAXES Taxes as Share of Family Income Top 20% Income Group Lowest 20% Second 20% Middle 20% Fourth 20% Next 15% Next 4% Top 1% Income Range Less than $19,400 $19,400 to $30,800 $30,800 to $49,700 $49,700 to $83,800 $83,800 to $185,500 $185,500 to $416,000 […]
New Jersey: Who Pays? 6th Edition
October 17, 2018 • By ITEP Staff
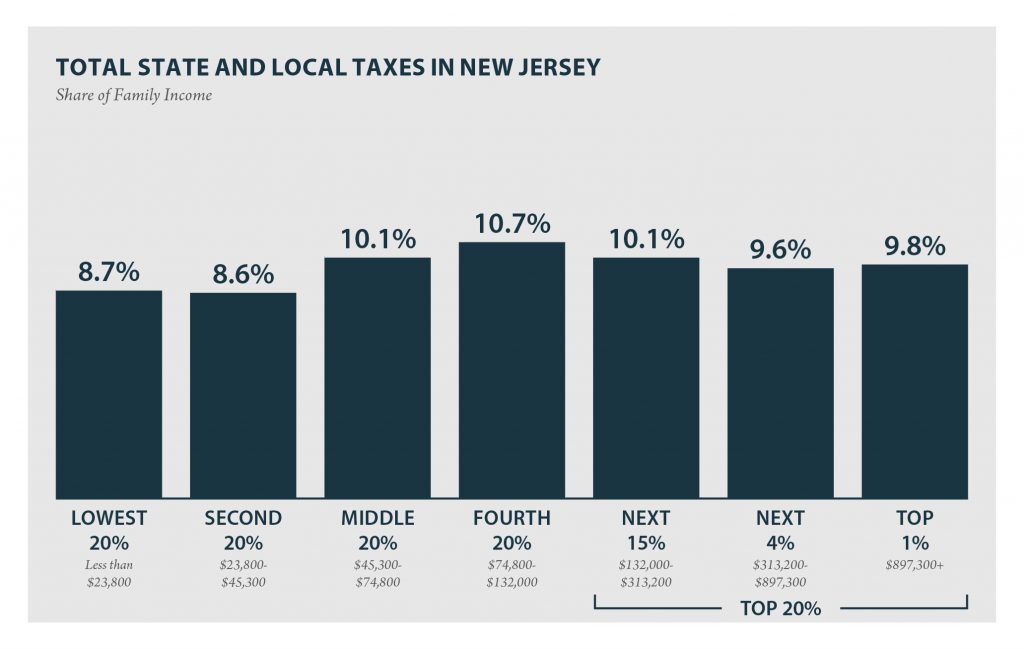
According to ITEP’s Tax Inequality Index, New Jersey’s state and local tax system does not worsen income inequality and ranks 46th on the index. The large income gap between lower- and middle-income taxpayers, as compared to the wealthy, is somewhat narrower after state and local taxes than before.
Maryland: Who Pays? 6th Edition
October 17, 2018 • By ITEP Staff
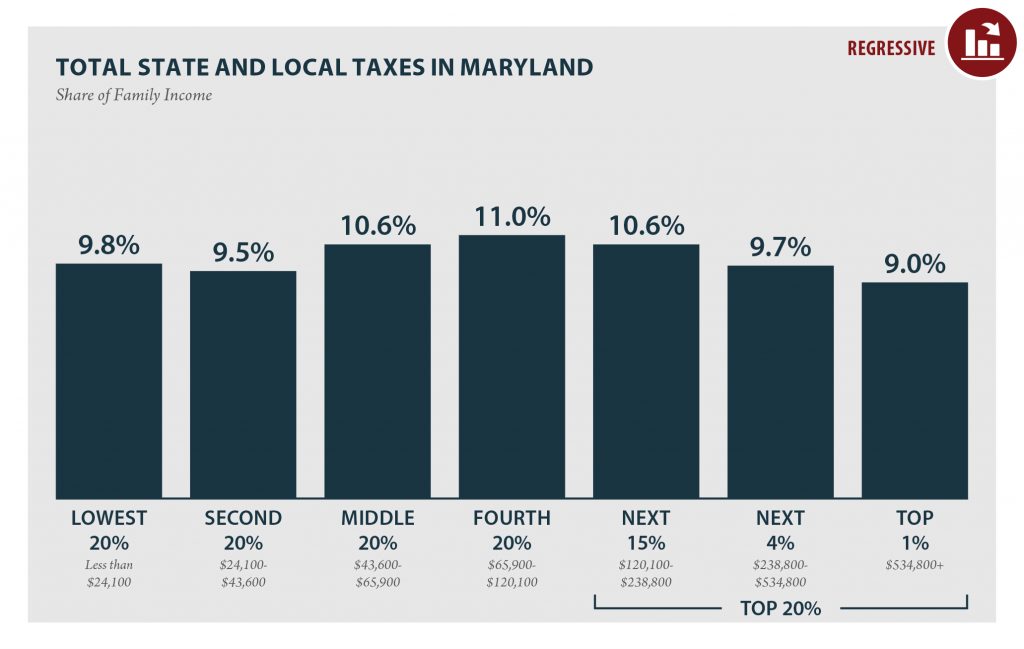
MARYLAND Read as PDF MARYLAND STATE AND LOCAL TAXES Taxes as Share of Family Income Top 20% Income Group Lowest 20% Second 20% Middle 20% Fourth 20% Next 15% Next 4% Top 1% Income Range Less than $24,100 $24,100 to $43,600 $43,600 to $65,900 $65,900 to $120,100 $120,100 to $238,800 $238,800 to $534,800 over $534,800 […]
Michigan: Who Pays? 6th Edition
October 17, 2018 • By ITEP Staff

MICHIGAN Read as PDF MICHIGAN STATE AND LOCAL TAXES Taxes as Share of Family Income Top 20% Income Group Lowest 20% Second 20% Middle 20% Fourth 20% Next 15% Next 4% Top 1% Income Range Less than $17,600 $17,600 to $33,000 $33,000 to $57,100 $57,100 to $95,900 $95,900 to $199,600 $199,600 to $422,100 over $422,100 […]
Nevada: Who Pays? 6th Edition
October 17, 2018 • By ITEP Staff
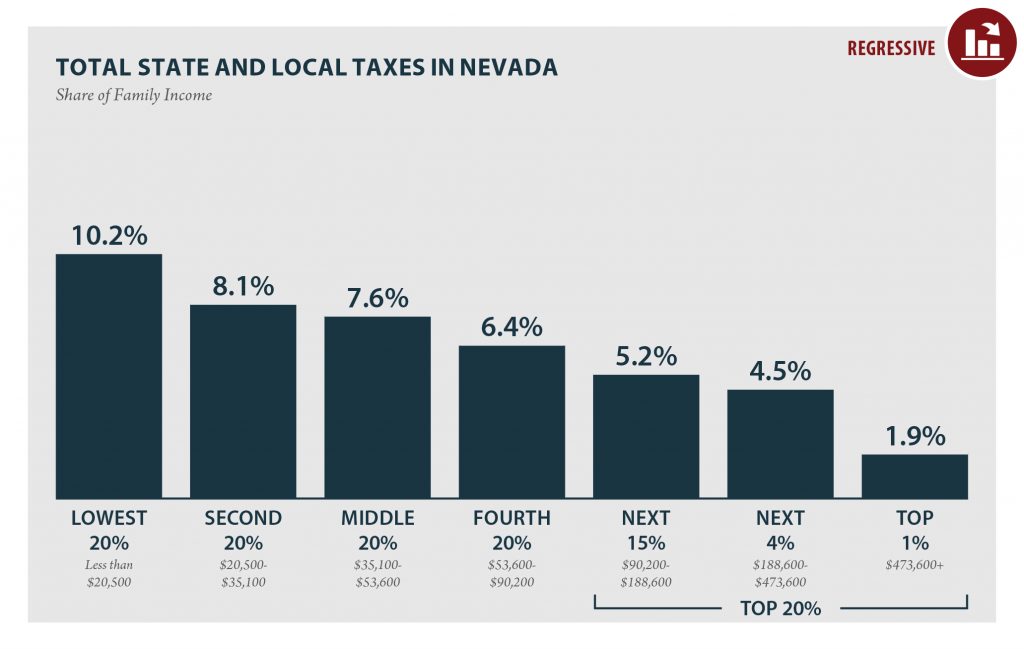
NEVADA Read as PDF NEVADA STATE AND LOCAL TAXES Taxes as Share of Family Income Top 20% Income Group Lowest 20% Second 20% Middle 20% Fourth 20% Next 15% Next 4% Top 1% Income Range Less than $20,500 $20,500 to $35,100 $35,100 to $53,600 $53,600 to $90,200 $90,200 to $188,600 $188,600 to $473,600 over $473,600 […]
Wisconsin: Who Pays? 6th Edition
October 17, 2018 • By ITEP Staff
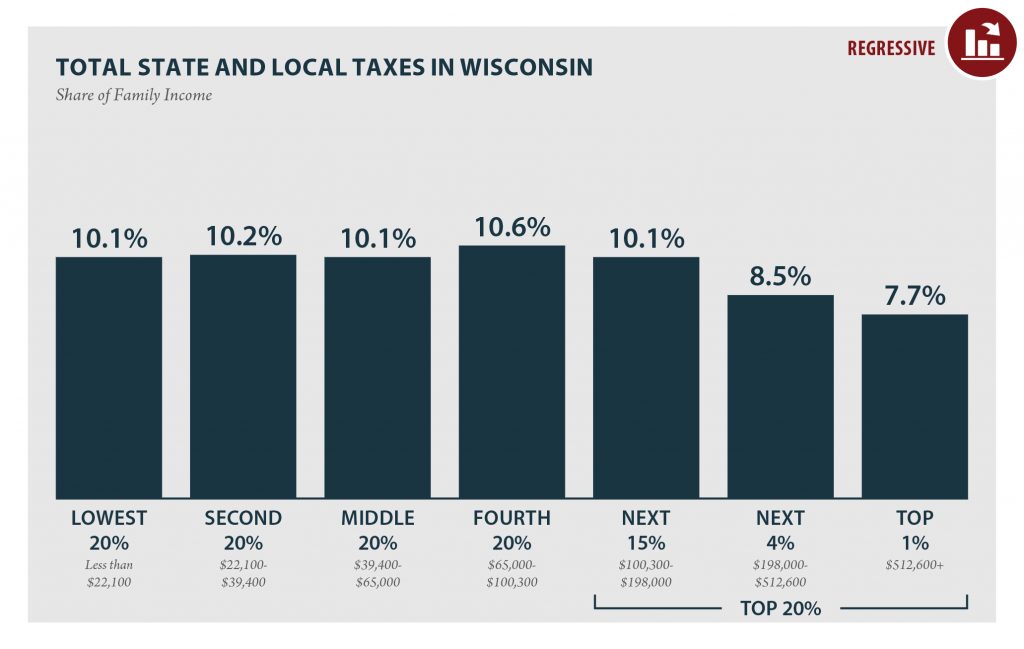
WISCONSIN Read as PDF WISCONSIN STATE AND LOCAL TAXES Taxes as Share of Family Income Top 20% Income Group Lowest 20% Second 20% Middle 20% Fourth 20% Next 15% Next 4% Top 1% Income Range Less than $22,100 $22,100 to $39,400 $39,400 to $65,000 $65,000 to $100,300 $100,300 to $198,000 $198,000 to $512,600 over $512,600 […]
Mississippi: Who Pays? 6th Edition
October 17, 2018 • By ITEP Staff
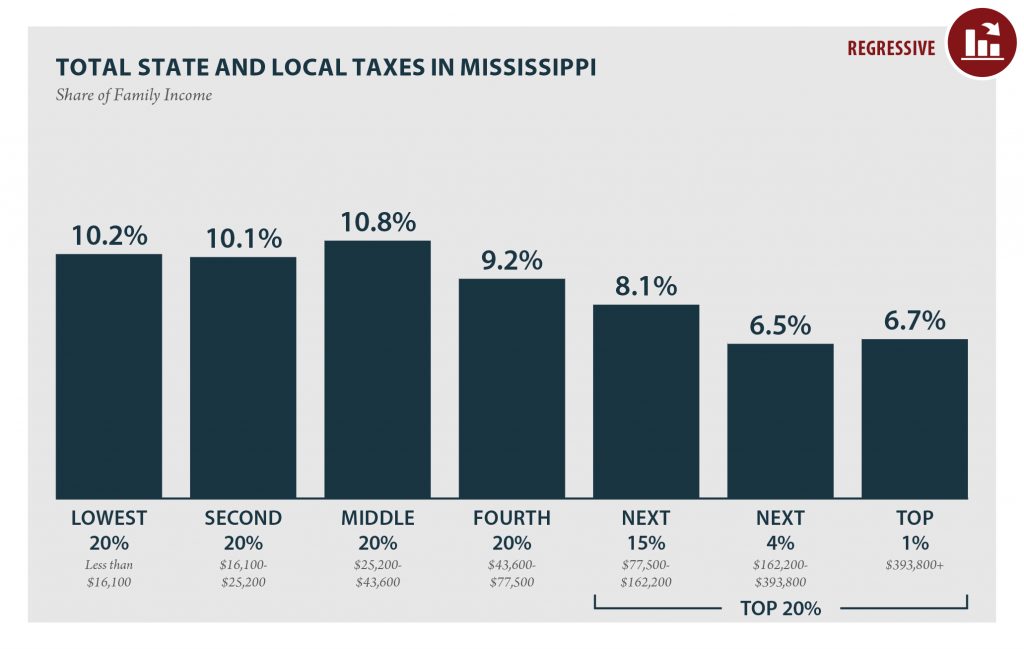
MISSISSIPPI Read as PDF MISSISSIPPI STATE AND LOCAL TAXES Taxes as Share of Family Income Top 20% Income Group Lowest 20% Second 20% Middle 20% Fourth 20% Next 15% Next 4% Top 1% Income Range Less than $16,100 $16,100 to $25,200 $25,200 to $43,600 $43,600 to $77,500 $77,500 to $162,200 $162,200 to $393,800 over $393,800 […]
Arkansas: Who Pays? 6th Edition
October 17, 2018 • By ITEP Staff
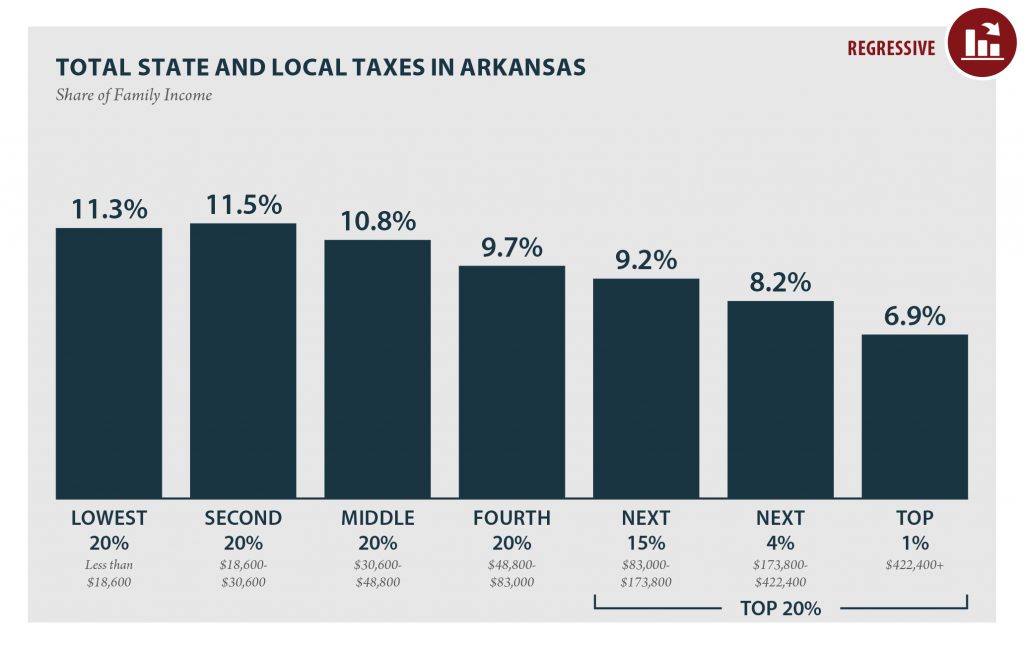
ARKANSAS Read as PDF ARKANSAS STATE AND LOCAL TAXES Taxes as Share of Family Income Top 20% Income Group Lowest 20% Second 20% Middle 20% Fourth 20% Next 15% Next 4% Top 1% Income Range Less than $18,600 $18,600 to $30,600 $30,600 to $48,800 $48,800 to $83,000 $83,000 to $173,800 $173,800 to $422,400 over $422,400 […]
Pennsylvania: Who Pays? 6th Edition
October 17, 2018 • By ITEP Staff
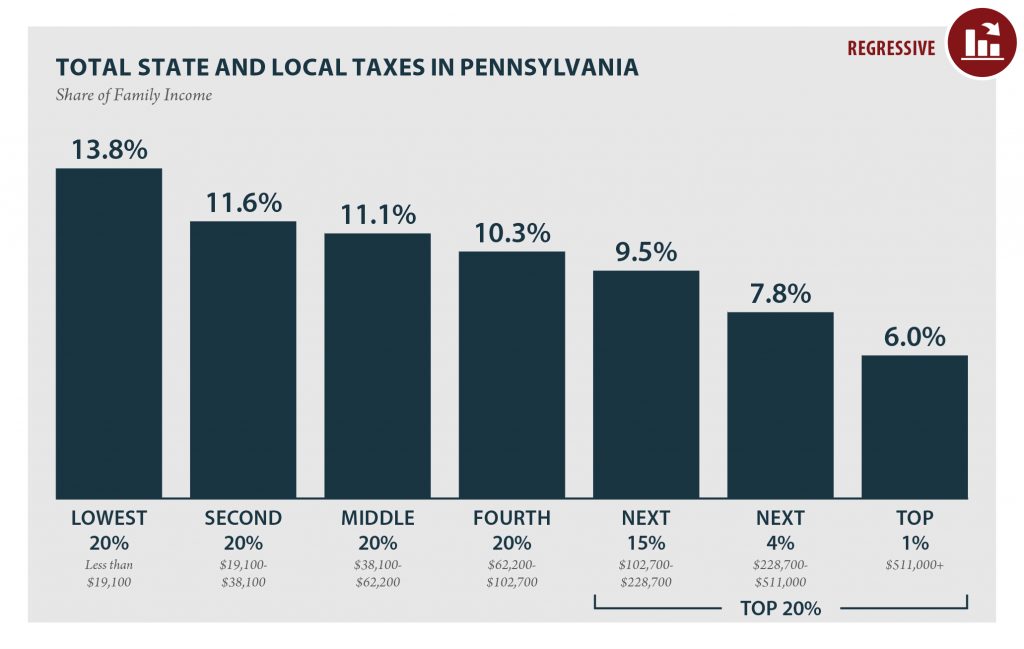
PENNSYLVANIA Read as PDF PENNSYLVANIA STATE AND LOCAL TAXES Taxes as Share of Family Income Top 20% Income Group Lowest 20% Second 20% Middle 20% Fourth 20% Next 15% Next 4% Top 1% Income Range Less than $19,100 $19,100 to $38,100 $38,100 to $62,200 $62,200 to $102,700 $102,700 to $228,700 $228,700 to $511,000 over $511,000 […]
New York: Who Pays? 6th Edition
October 17, 2018 • By ITEP Staff
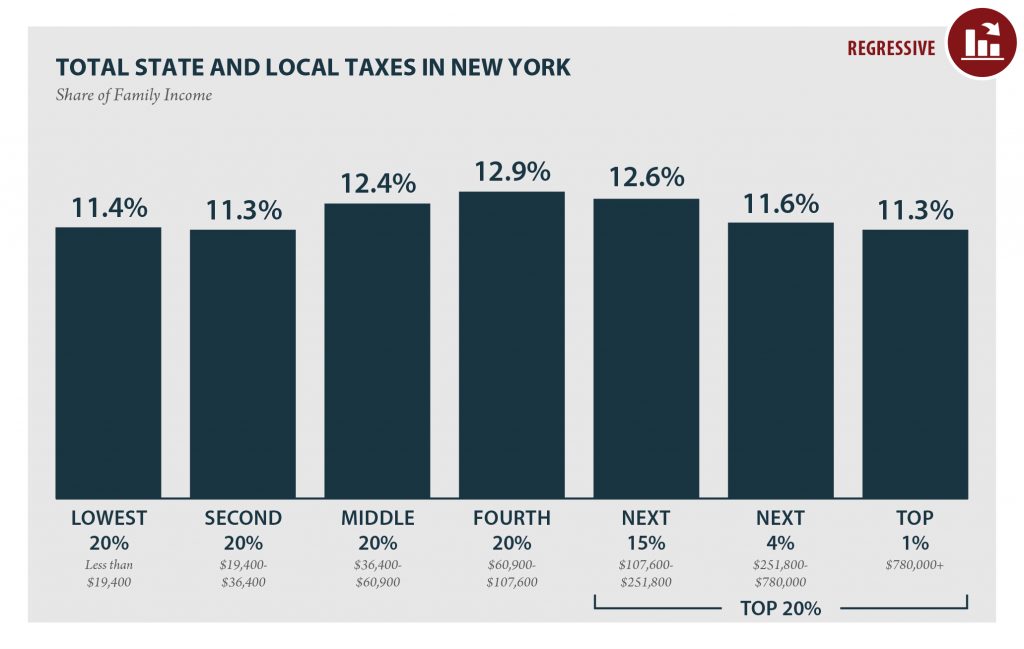
NEW YORK Read as PDF NEW YORK STATE AND LOCAL TAXES Taxes as Share of Family Income Top 20% Income Group Lowest 20% Second 20% Middle 20% Fourth 20% Next 15% Next 4% Top 1% Income Range Less than $19,400 $19,400 to $36,400 $36,400 to $60,900 $60,900 to $107,600 $107,600 to $251,800 $251,800 to $780,000 […]
Texas: Who Pays? 6th Edition
October 17, 2018 • By ITEP Staff
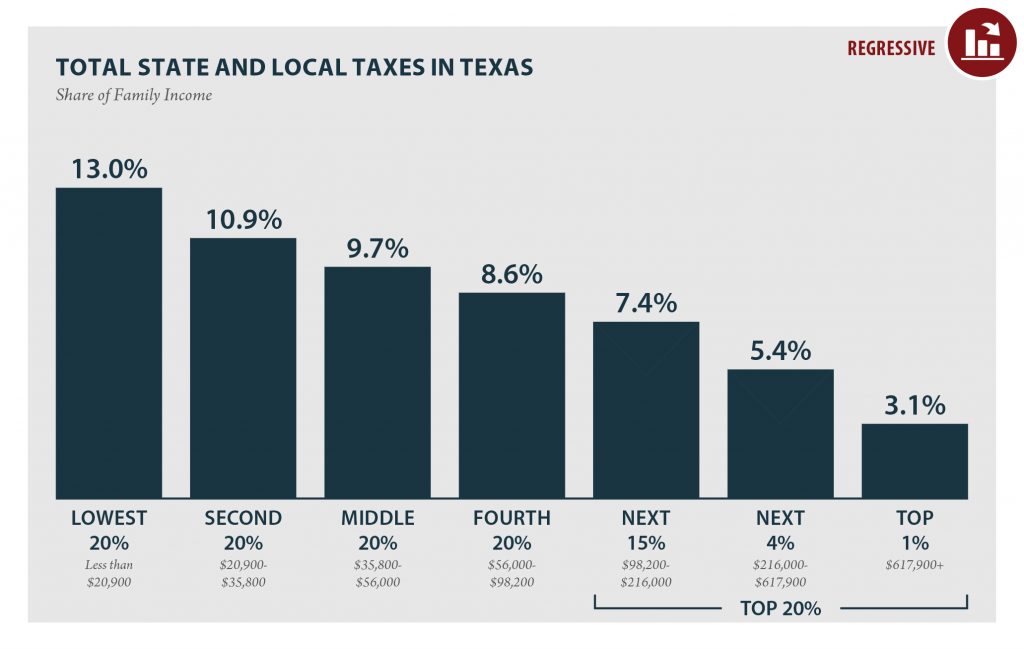
TEXAS Read as PDF TEXAS STATE AND LOCAL TAXES Taxes as Share of Family Income Top 20% Income Group Lowest 20% Second 20% Middle 20% Fourth 20% Next 15% Next 4% Top 1% Income Range Less than $20,900 $20,900 to $35,800 $35,800 to $56,000 $56,000 to $98,200 $98,200 to $216,000 $216,000 to $617,900 over $617,900 […]
Louisiana: Who Pays? 6th Edition
October 17, 2018 • By ITEP Staff
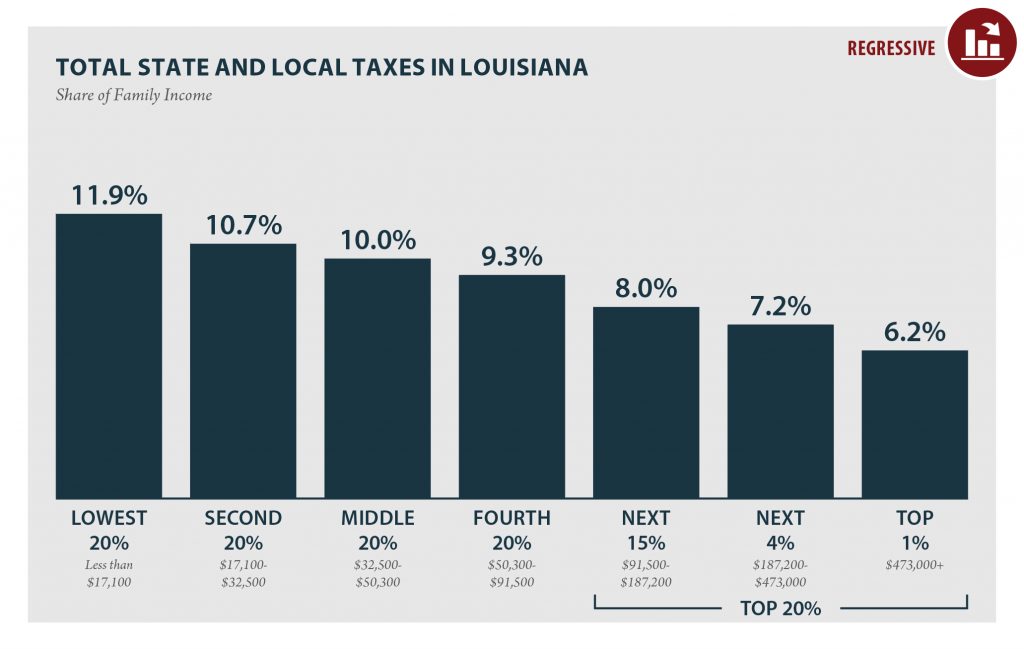
LOUISIANA Read as PDF LOUISIANA STATE AND LOCAL TAXES Taxes as Share of Family Income Top 20% Income Group Lowest 20% Second 20% Middle 20% Fourth 20% Next 15% Next 4% Top 1% Income Range Less than $17,100 $17,100 to $32,500 $32,500 to $50,300 $50,300 to $91,500 $91,500 to $187,200 $187,200 to $473,000 over $473,000 […]
Connecticut: Who Pays? 6th Edition
October 17, 2018 • By ITEP Staff
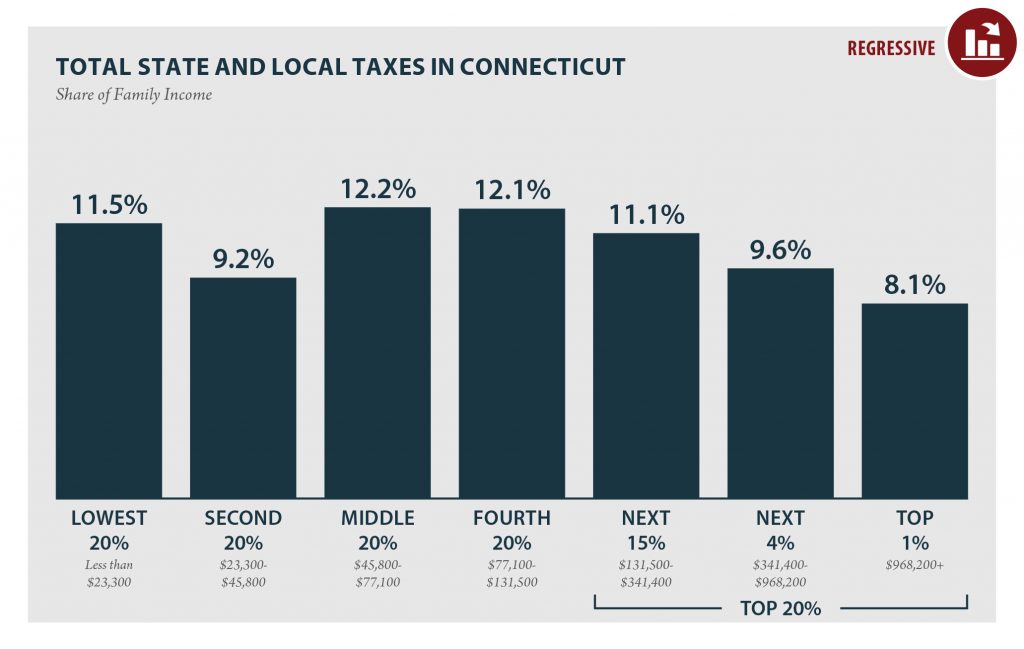
CONNECTICUT Read as PDF CONNECTICUT STATE AND LOCAL TAXES Taxes as Share of Family Income Top 20% Income Group Lowest 20% Second 20% Middle 20% Fourth 20% Next 15% Next 4% Top 1% Income Range Less than $23,300 $23,300 to $45,800 $45,800 to $77,100 $77,100 to $131,500 $131,500 to $341,400 $341,400 to $968,200 over $968,200 […]

Institute on Taxation
and Economic Policy
ITEP is a non-profit, non-partisan tax policy organization. We conduct rigorous analyses of tax and economic proposals and provide data-driven recommendations to shape equitable and sustainable tax systems.
Subscribe to ITEP Emails
Tax research and policy news in your inbox.
Promote Fair Tax Policy
Your gift to ITEP promotes tax justice. With your help, we do research that supports taxing millionaires and billionaires, taxing big corporations and raising revenue for the things our people, our communities and our planet need.
Together, we can create a country with more economic justice, more racial justice, more climate justice… and more tax justice.