Recent Work
2185 items
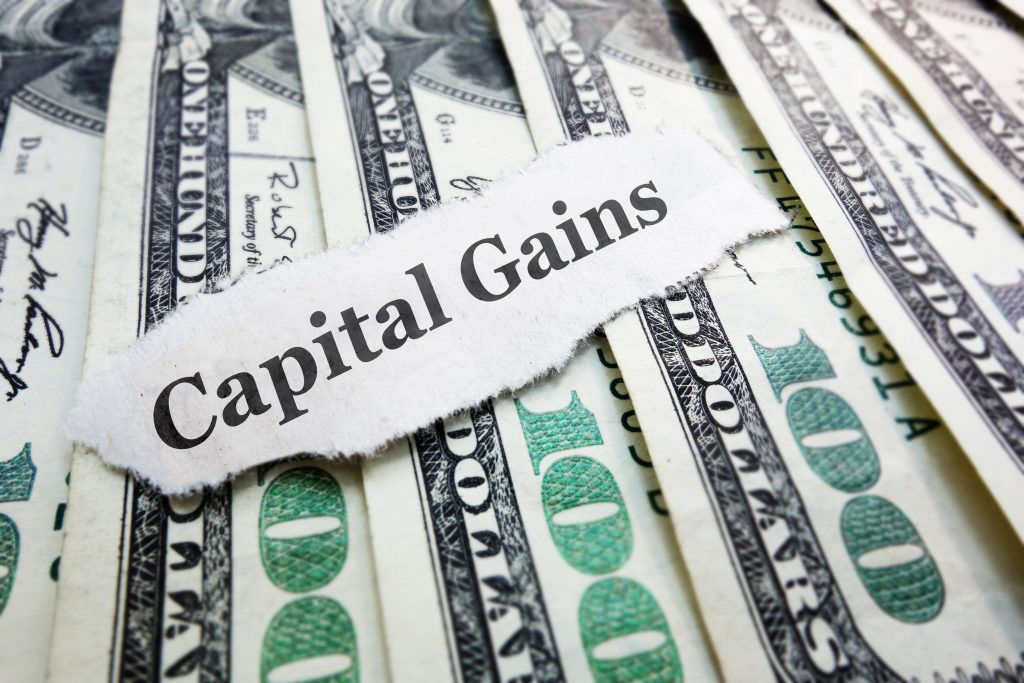
Sen. Ron Wyden of Oregon, the ranking Democrat on the Senate Finance Committee, announced that he would soon release a proposal to eliminate massive tax breaks enjoyed by the wealthy on their capital gains income. If successful, the proposal would ensure that income from wealth is taxed just like income from work.
What to Watch for When the IRS Releases Its SALT Workaround Regulations
April 1, 2019 • By Carl Davis

The Treasury Department and IRS last summer proposed regulations that would make it more difficult for taxpayers to avoid the $10,000 cap on deductions for state and local taxes (SALT). Now, likely days away from the unveiling of the final version of IRS regulations on SALT cap workarounds, Carl Davis recaps the finer points ITEP will be watching for when the regulations become public.
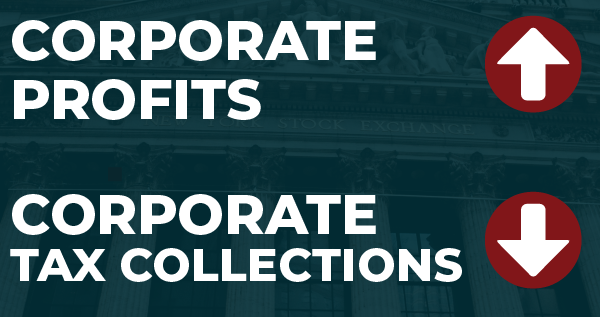
This month in tax policy news: Corporate profits soar while corporate tax collections plummet. Also inside: A look at regressive state tax policies and progressive remedies and the continued unpackaging of the Tax Cuts and Jobs Act. It's ITEP's March 2019 Monthly Digest.
The Trump Tax Law Further Tilted an Already Uneven Playing Field
March 27, 2019 • By Jessica Schieder
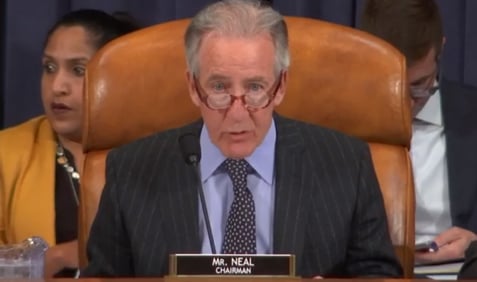
Proponents sold the Tax Cuts and Jobs Act (TCJA) as a way to spur new investment, increase workers’ paychecks, and reverse the off-shoring of jobs. Testimony presented during a House Ways and Means hearing held today reflected on how—more than a year after the law’s passage—each of those pitches ring hollow.
State Rundown 3/27: Spring Bringing Smart State Tax Policy So Far
March 27, 2019 • By ITEP Staff
Though a long winter and a rough start to spring weather have wreaked havoc in much of the country, lawmakers are off to a good start in the world of state fiscal policy so far. In the last week, a progressive revenue package was passed in the nick of time in NEW MEXICO, a service-sapping tax cut was vetoed in KANSAS, and a regressive and unsustainable tax shift was soundly defeated in NORTH DAKOTA. Meanwhile, gas tax updates are on the table in MAINE, MINNESOTA, and OHIO. And exemptions for feminine hygiene products and diapers were enacted in VIRGINIA and introduced in MISSOURI.
Data released Friday by the U.S. Treasury Department should give great pause to all who care about the federal government’s ability to raise revenue in a fair, sustainable way. In the wake of the 2017 corporate tax overhaul, corporate tax collections have fallen at a rate never seen during a period of economic growth.
A 2019 ITEP analysis found that Black and Latinx households are overrepresented in the lowest-income quintiles; while they represent about 22 percent of overall tax returns, they account for 30 percent of the poorest quintile of taxpayers.
Rep. Doggett and Sen. Whitehouse Reintroduce Bill to End Offshore Tax Avoidance
March 15, 2019 • By Lorena Roque

On Thursday, Representative Lloyd Doggett and Senator Sheldon Whitehouse announced that they are reintroducing the “No Tax Breaks for Outsourcing Act.” Our international corporate tax rules have been a mess for a long time, and Tax Cuts and Jobs Act (TCJA) failed to resolve the problems. The old rules and the new rules under TCJA both tax offshore corporate profits more lightly than domestic corporate profits, but in different ways. The No Tax Breaks for Outsourcing Act would create rules that tax domestic profits and foreign profits in the same way.
More than three billion dollars could be raised under a major progressive tax plan proposed by Illinois Gov. J.B. Pritzker this week, the point being to simultaneously improve the state’s upside-down tax code and address its notorious budget gap issues. One state, Utah, may already be looking at a special session to revisit the sales tax reform debate that ended this week without resolution, in contrast to Alabama and Arkansas, where leaders finally resolved years-long debates over gas taxes and infrastructure funding. And lawmakers in four states – California, Florida, Minnesota, and North Carolina – introduced legislation to expand or…
North Dakota Senate Should Put the Freeze on House Tax-Cut Plan
March 11, 2019 • By Dylan Grundman O'Neill
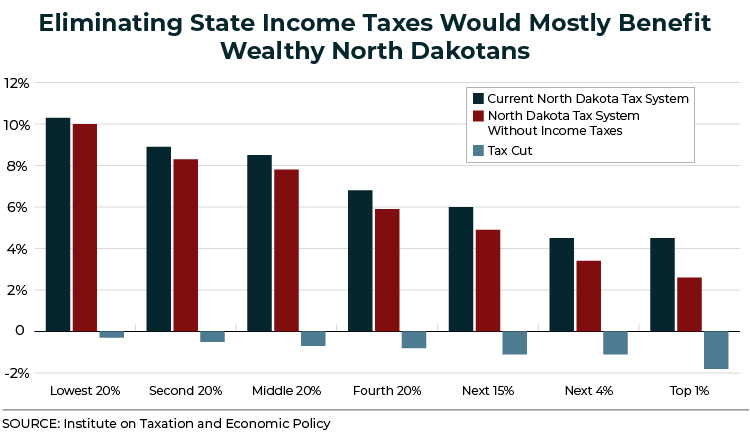
Lawmakers in Bismarck were treated last weekend to the largest single day of snowfall the city has ever seen. As state senators begin weighing a bill recently passed by the House that would replace the state's income taxes with oil revenue, they might want to reflect on how similar oil revenue is to the snow: although both are in extreme abundance right now, both are volatile and unpredictable and will melt away sooner than later. Lawmakers should also consider how eliminating the state's income taxes might warm the hearts of wealthier North Dakotans but would leave most North Dakota families…
State Rundown 3/6: March Tax Debates Contain Sanity Amid Usual Madness
March 6, 2019 • By ITEP Staff
State policymakers around the nation this week served up a handful of harmful and upside-down tax proposals, but these were refreshingly outnumbered by sound tax and budget policy proposals in several other states. NEW JERSEY Gov. Phil Murphy made tax fairness an explicit priority in his budget address, the NEW MEXICO House passed progressive reforms to improve the state’s schools and tax code, states such as VERMONT are looking to raise funds from legalized cannabis and put it to good use, and many states, including ALABAMA, ARKANSAS, OHIO, and WISCONSIN, are seriously considering much-needed gas tax updates to improve their…
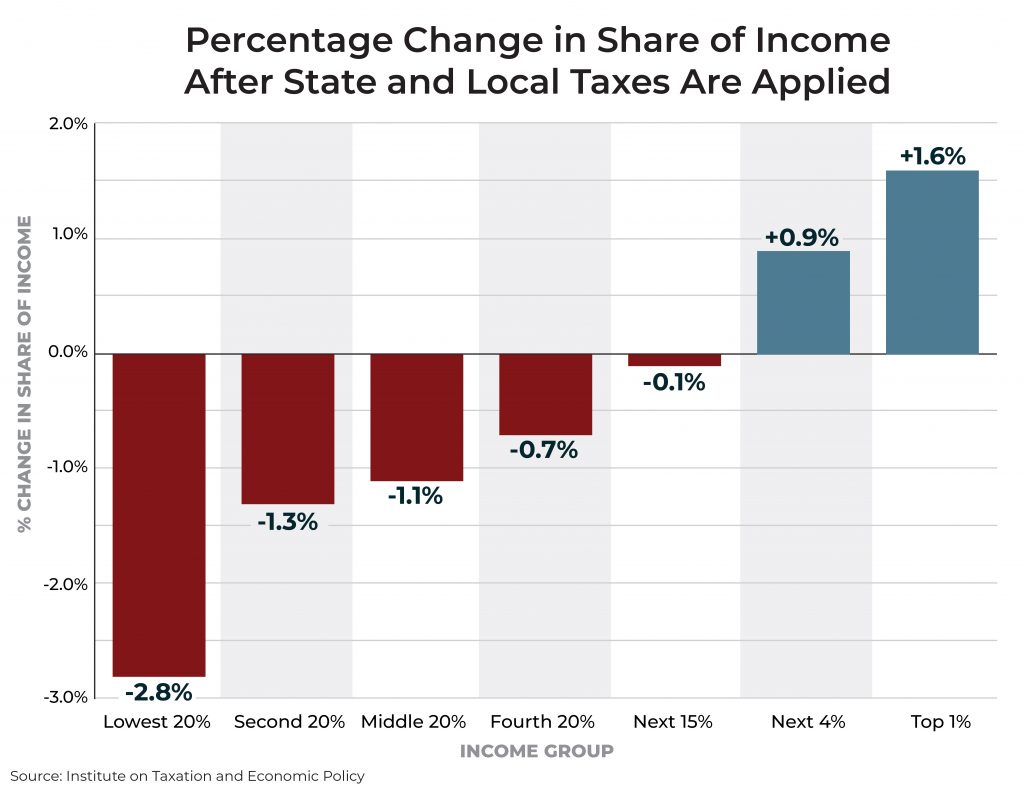
The nation is currently engaging in serious discourse about how to expand economic opportunity and remedy income inequality via the federal tax code. State tax systems are also important and have a dismal effect on the growing economic divide. In a new report, Fairness Matters: A Chart Book on Who Pays State and Local Taxes, we further parse our Who Pays? data.
Fairness Matters: A Chart Book on Who Pays State and Local Taxes
March 6, 2019 • By ITEP Staff
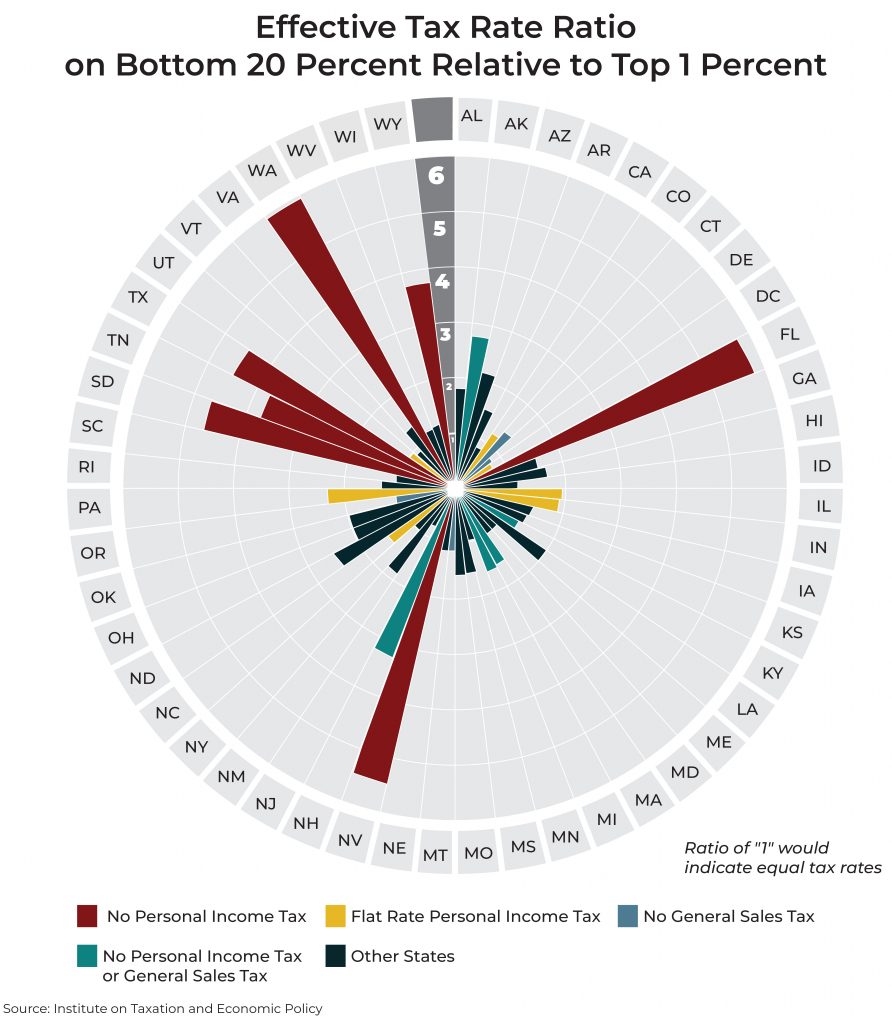
There is significant room for improvement in state and local tax codes. State tax codes are filled with top-heavy exemptions and deductions and often fail to tax higher incomes at higher rates. States and localities have come to rely too heavily on regressive sales taxes that fail to reflect the modern economy. And overall tax collections are often inadequate in the short-run and unsustainable in the long-run. These types of shortcomings provide compelling reason to pursue state and local tax reforms to make these systems more equitable, adequate, and sustainable.
State Rundown 2/27: Temperatures and Tax Fights Continue to Polarize
February 27, 2019 • By ITEP Staff
As another polar vortex heads for large swaths of the country, state tax debates this week were highly polarized in another way. Lawmakers and advocates in MICHIGAN, OHIO, OREGON, UTAH, and elsewhere fought to enact or improve state Earned Income Tax Credits to give a boost to low- and middle-income working families. But the opposite extreme was heavily represented as well, as others pushed for regressive tax cuts for wealthy individuals and corporations, including in KANSAS, NEBRASKA, NORTH DAKOTA, OHIO, UTAH, and WEST VIRGINIA. Even our “What We’re Reading” section has informative reading on how education funding policy continues to…

State tax policy can be a contentious topic, but one issue on which lawmakers largely agree is that higher gas tax rates are necessary to keep our nation’s infrastructure operating safely and efficiently. Lawmakers in 27 states have approved gas tax increases since 2013.

Institute on Taxation
and Economic Policy
ITEP is a non-profit, non-partisan tax policy organization. We conduct rigorous analyses of tax and economic proposals and provide data-driven recommendations to shape equitable and sustainable tax systems.
Subscribe to ITEP Emails
Tax research and policy news in your inbox.
Promote Fair Tax Policy
Your gift to ITEP promotes tax justice. With your help, we do research that supports taxing millionaires and billionaires, taxing big corporations and raising revenue for the things our people, our communities and our planet need.
Together, we can create a country with more economic justice, more racial justice, more climate justice… and more tax justice.