Who Pays?
Low Tax for Whom? Indiana is a “Low Tax State” Overall, But Not for Families Living in Poverty
October 17, 2018 • By ITEP Staff
Indiana’s tax system has vastly different impacts on taxpayers at different income levels. For instance, the lowest-income 20 percent of Hoosiers contribute 12.8 percent of their income in state and local taxes — considerably more than any other income group in the state. For low-income families, Indiana is far from being a low tax state; in fact, it is the eighth highest-tax state in the country for low-income families.
Low Tax for Whom? Oklahoma is a “Low Tax State” Overall, But Not for Families Living in Poverty
October 17, 2018 • By ITEP Staff
Oklahoma’s tax system has vastly different impacts on taxpayers at different income levels. For instance, the lowest-income 20 percent of Oklahomans contribute 13.2 percent of their income in state and local taxes — considerably more than any other income group in the state. For low-income families, Oklahoma is far from being a low tax state; in fact, it is the fifth highest-tax state in the country for low-income families.
Low Tax for Whom? Florida is a “Low Tax State” Overall, But Not for Families Living in Poverty
October 17, 2018 • By ITEP Staff

Florida’s tax system has vastly different impacts on taxpayers at different income levels. For instance, the lowest-income 20 percent of Floridians contribute 12.7 percent of their income in state and local taxes — considerably more than any other income group in the state. For low-income families, Florida is far from being a low tax state; in fact, it is the ninth highest-tax state in the country for low-income families.
West Virginia: Who Pays? 6th Edition
October 17, 2018 • By ITEP Staff
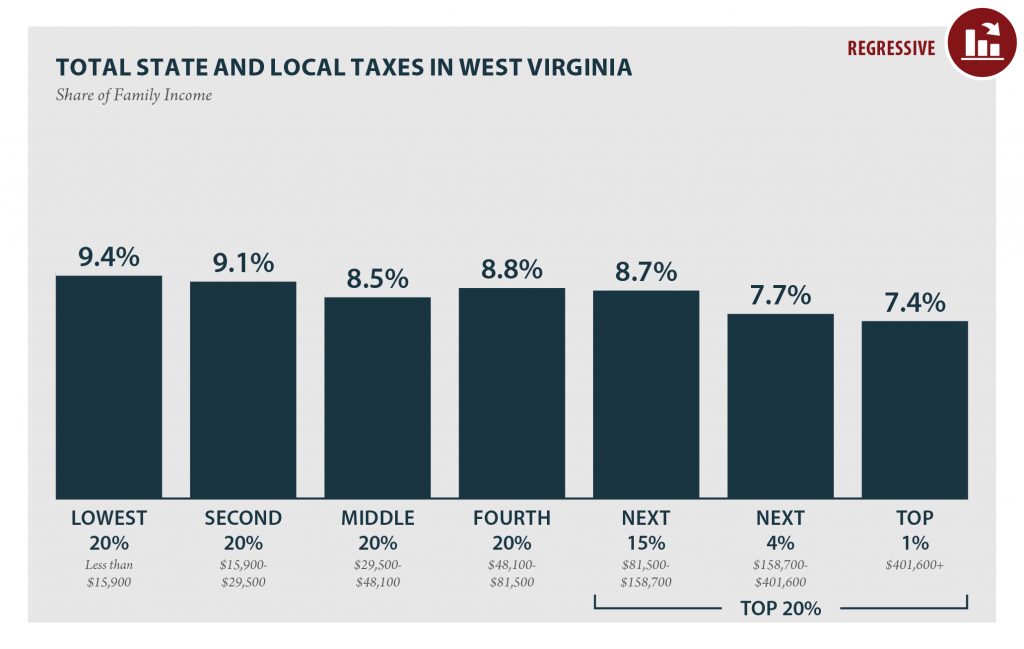
According to ITEP’s Tax Inequality Index, which measures the impact of each state’s tax system on income inequality, West Virginia has the 37th most unfair state and local tax system in the country. Incomes are more unequal in West Virginia after state and local taxes are collected than before.
District of Columbia: Who Pays? 6th Edition
October 17, 2018 • By ITEP Staff
According to ITEP’s Tax Inequality Index, the District of Columbia’s local tax system does not worsen income inequality and ranks 50th on the index. The large income gap between lower- and middle-income taxpayers, as compared to the wealthy, is somewhat narrower after state and local taxes than before.
Rhode Island: Who Pays? 6th Edition
October 17, 2018 • By ITEP Staff
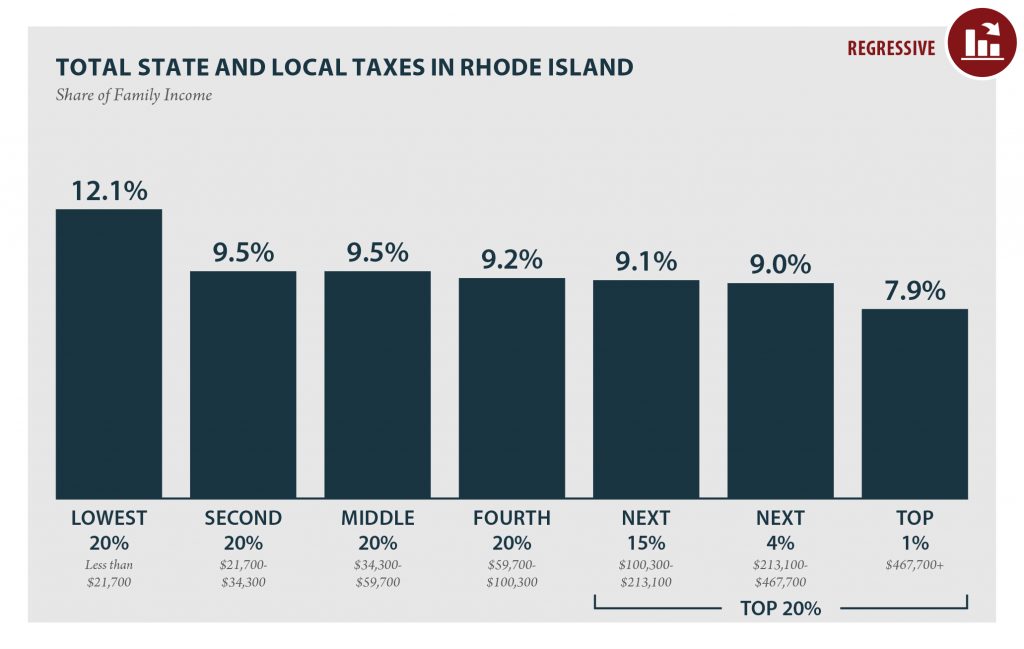
According to ITEP’s Tax Inequality Index, which measures the impact of each state’s tax system on income inequality, Rhode Island has the 32nd most unfair state and local tax system in the country. Incomes are more unequal in Rhode Island after state and local taxes are collected than before.
Colorado: Who Pays? 6th Edition
October 17, 2018 • By ITEP Staff
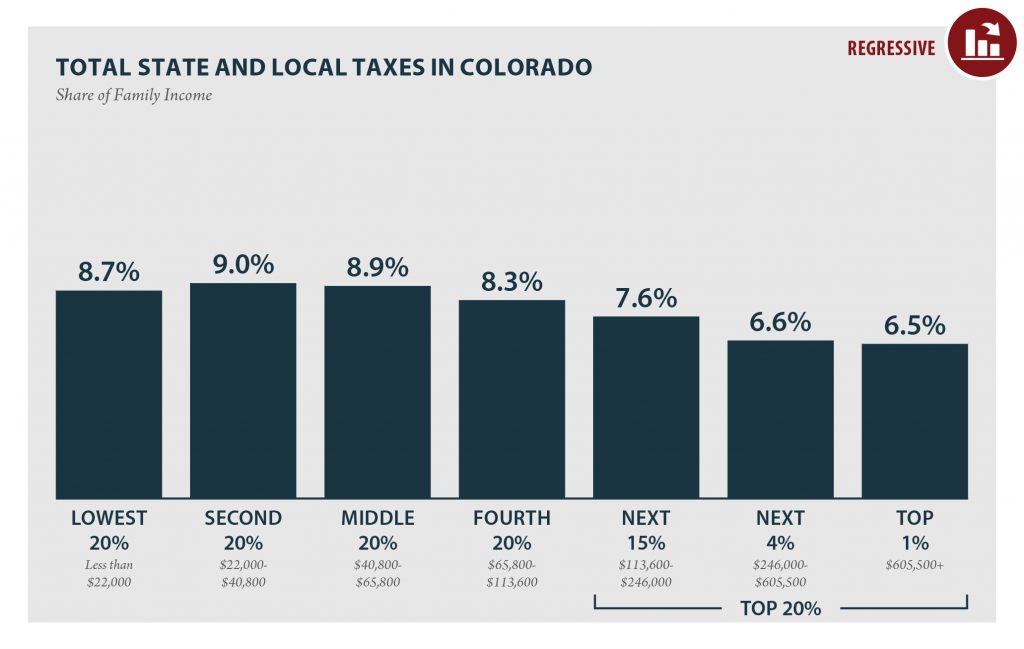
COLORADO Read as PDF COLORADO STATE AND LOCAL TAXES Taxes as Share of Family Income Top 20% Income Group Lowest 20% Second 20% Middle 20% Fourth 20% Next 15% Next 4% Top 1% Income Range Less than $22,000 $22,000 to $40,800 $40,800 to $65,800 $65,800 to $113,600 $113,600 to $246,000 $246,000 to $605,500 over $605,500 […]
North Dakota: Who Pays? 6th Edition
October 17, 2018 • By ITEP Staff
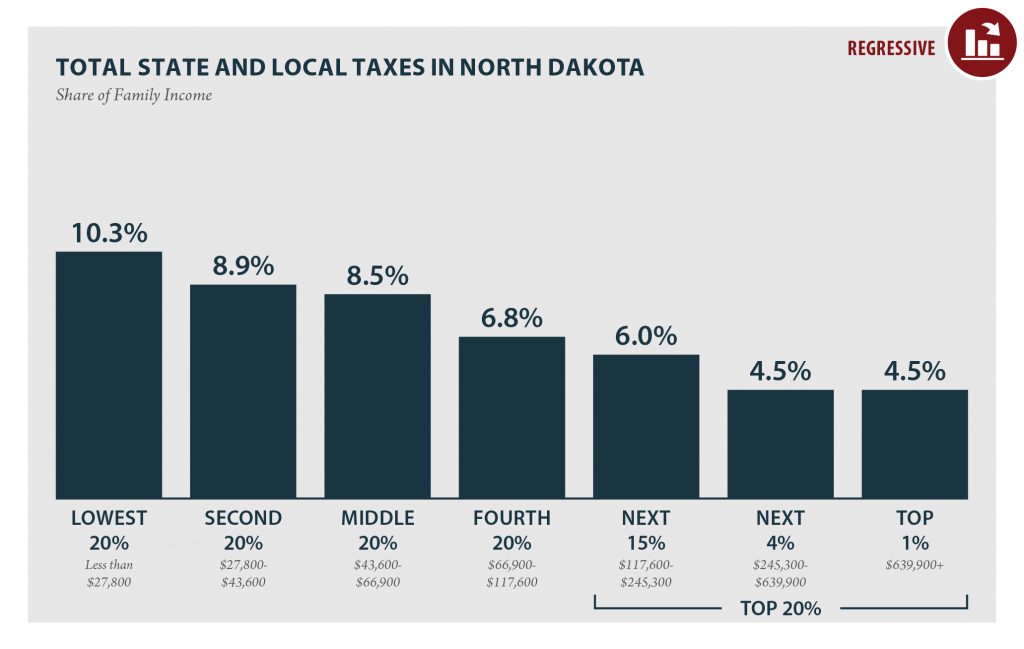
NORTH DAKOTA Read as PDF NORTH DAKOTA STATE AND LOCAL TAXES Taxes as Share of Family Income Top 20% Income Group Lowest 20% Second 20% Middle 20% Fourth 20% Next 15% Next 4% Top 1% Income Range Less than $27,800 $27,800 to $43,600 $43,600 to $66,900 $66,900 to $117,600 $117,600 to $245,300 $245,300 to $639,900 […]
District of Columbia: Who Pays? 6th Edition
October 17, 2018 • By ITEP Staff
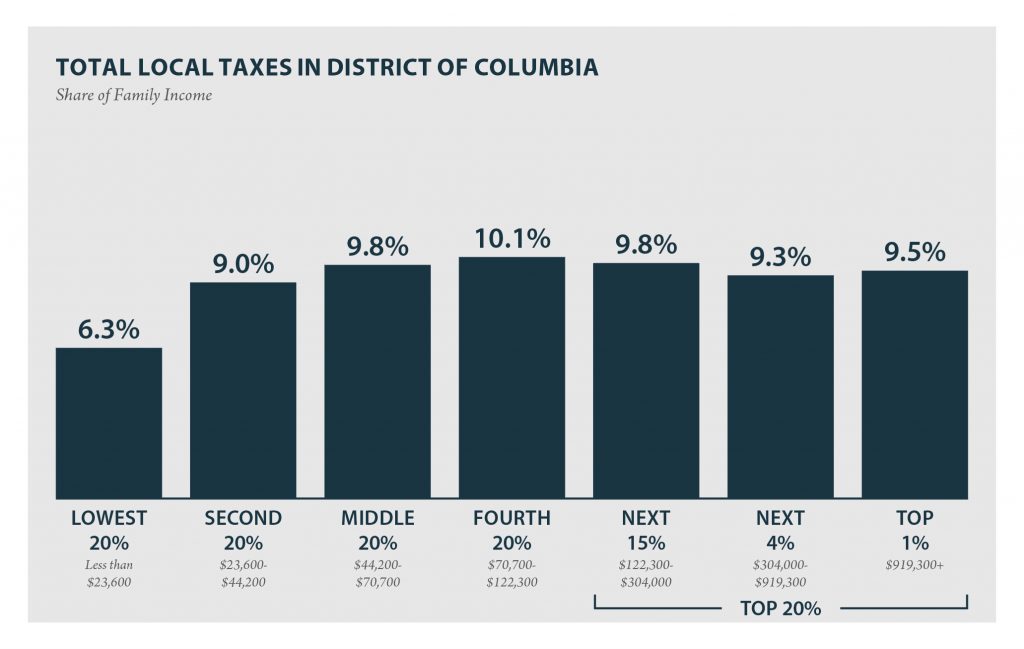
DISTRICT OF COLUMBIA Read as PDF DISTRICT OF COLUMBIA LOCAL TAXES Taxes as Share of Family Income Top 20% Income Group Lowest 20% Second 20% Middle 20% Fourth 20% Next 15% Next 5% Top 1% Income Range Less than $23,600 $23,600 to $44,200 $44,200 to $70,700 $70,700 to $122,300 $122,300 to $304,000 $304,000 to $919,300 […]
Georgia: Who Pays? 6th Edition
October 17, 2018 • By ITEP Staff
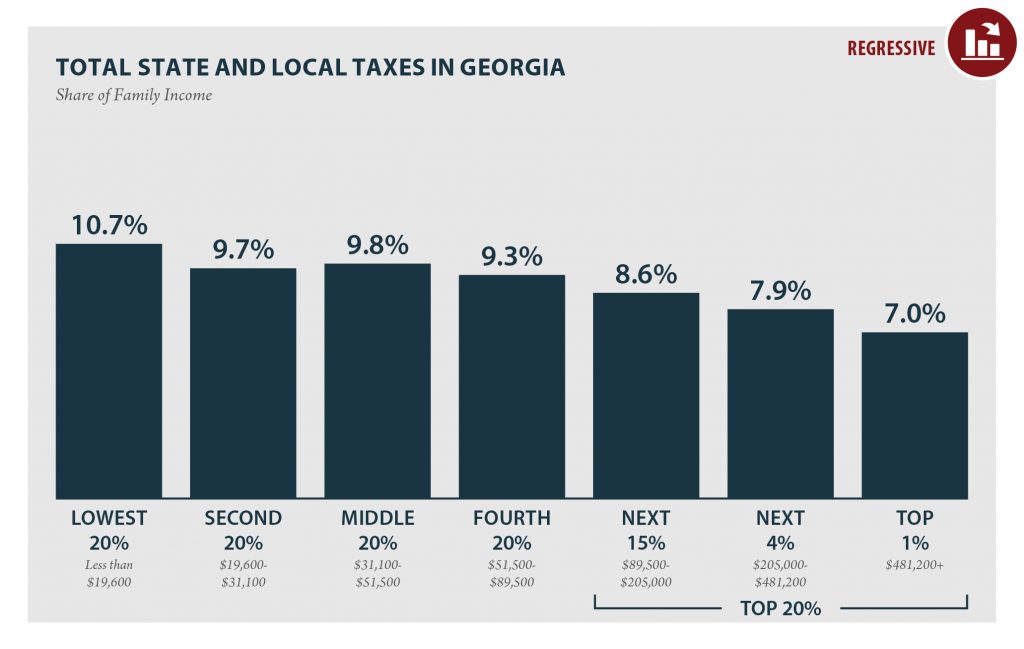
GEORGIA Read as PDF GEORGIA STATE AND LOCAL TAXES Taxes as Share of Family Income Top 20% Income Group Lowest 20% Second 20% Middle 20% Fourth 20% Next 15% Next 4% Top 1% Income Range Less than $19,600 $19,600 to $31,100 $31,100 to $51,500 $51,500 to $89,500 $89,500 to $205,000 $205,000 to $481,200 over $481,200 […]
Arizona: Who Pays? 6th Edition
October 17, 2018 • By ITEP Staff
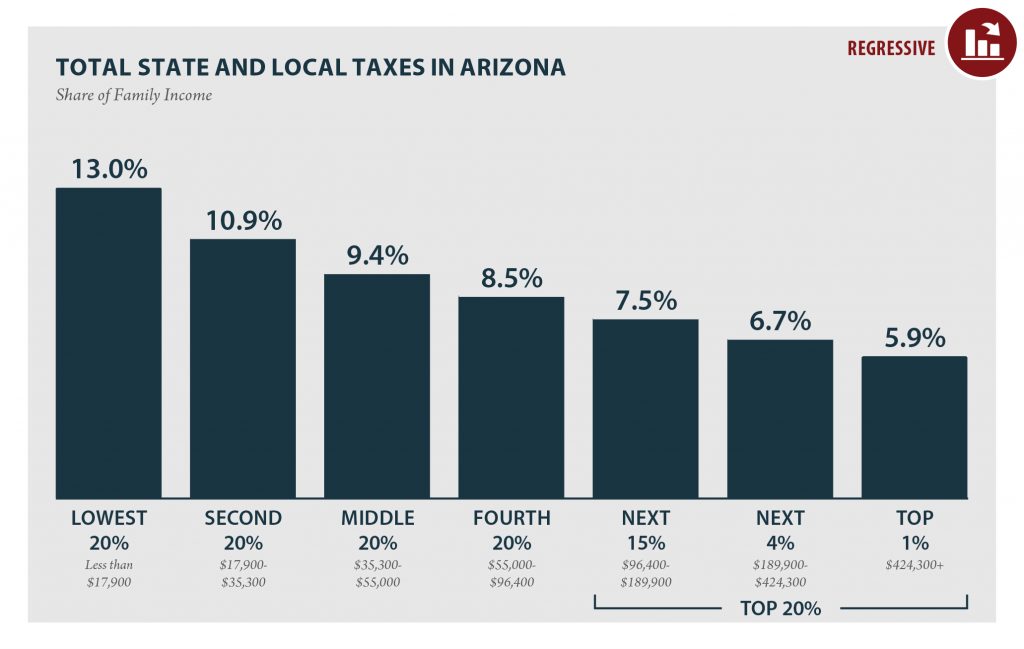
ARIZONA Read as PDF ARIZONA STATE AND LOCAL TAXES Taxes as Share of Family Income Top 20% Income Group Lowest 20% Second 20% Middle 20% Fourth 20% Next 15% Next 4% Top 1% Income Range Less than $17,900 $17,900 to $35,300 $35,300 to $55,000 $55,000 to $96,400 $96,400 to $189,900 $189,900 to $424,300 over $424,300 […]
Missouri: Who Pays? 6th Edition
October 17, 2018 • By ITEP Staff
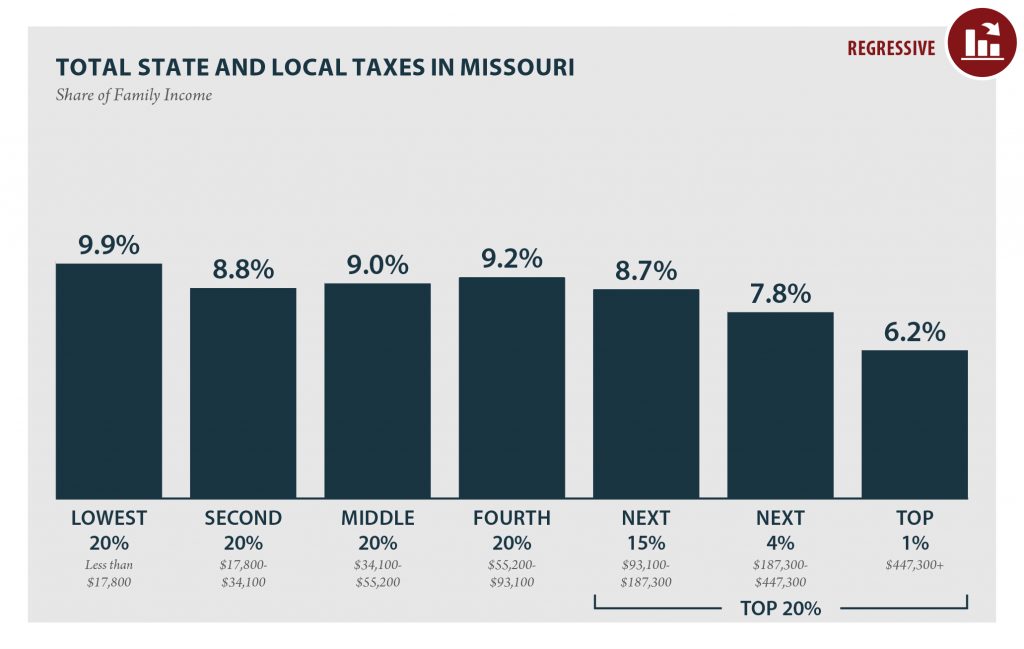
MISSOURI Read as PDF MISSOURI STATE AND LOCAL TAXES Taxes as Share of Family Income Top 20% Income Group Lowest 20% Second 20% Middle 20% Fourth 20% Next 15% Next 4% Top 1% Income Range Less than $17,800 $17,800 to $34,100 $34,100 to $55,200 $55,200 to $93,100 $93,100 to $187,300 $187,300 to $447,300 over $447,300 […]
Delaware: Who Pays? 6th Edition
October 17, 2018 • By ITEP Staff
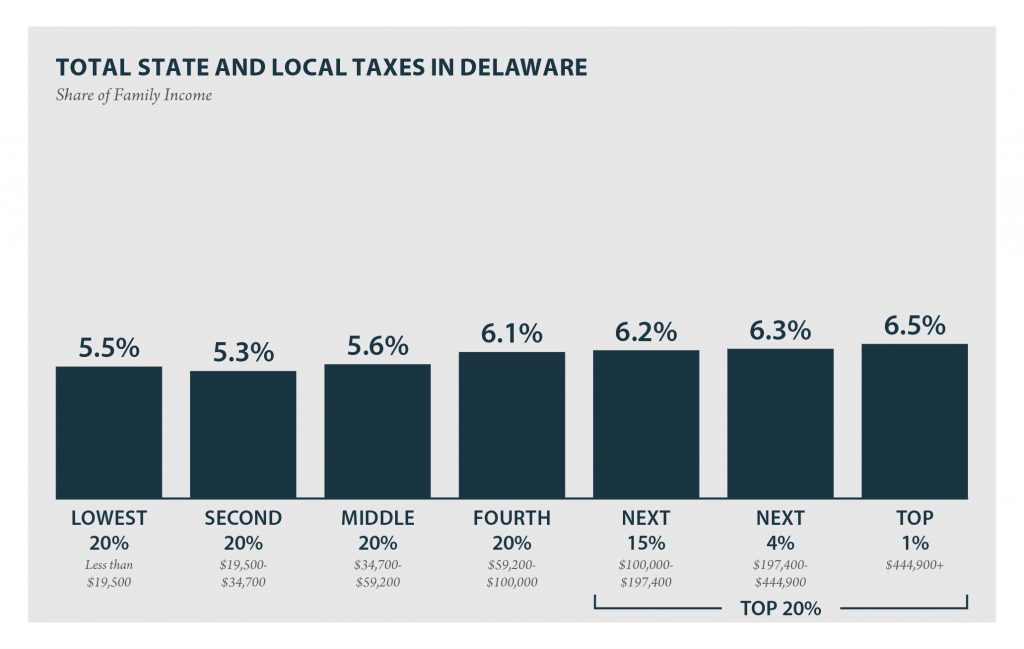
DELAWARE Read as PDF DELAWARE STATE AND LOCAL TAXES Taxes as Share of Family Income Top 20% Income Group Lowest 20% Second 20% Middle 20% Fourth 20% Next 15% Next 4% Top 1% Income Range Less than $19,500 $19,500 to $34,700 $34,700 to $59,200 $59,200 to $100,000 $100,000 to $197,400 $197,400 to $444,900 over $444,900 […]
Illinois: Who Pays? 6th Edition
October 17, 2018 • By ITEP Staff
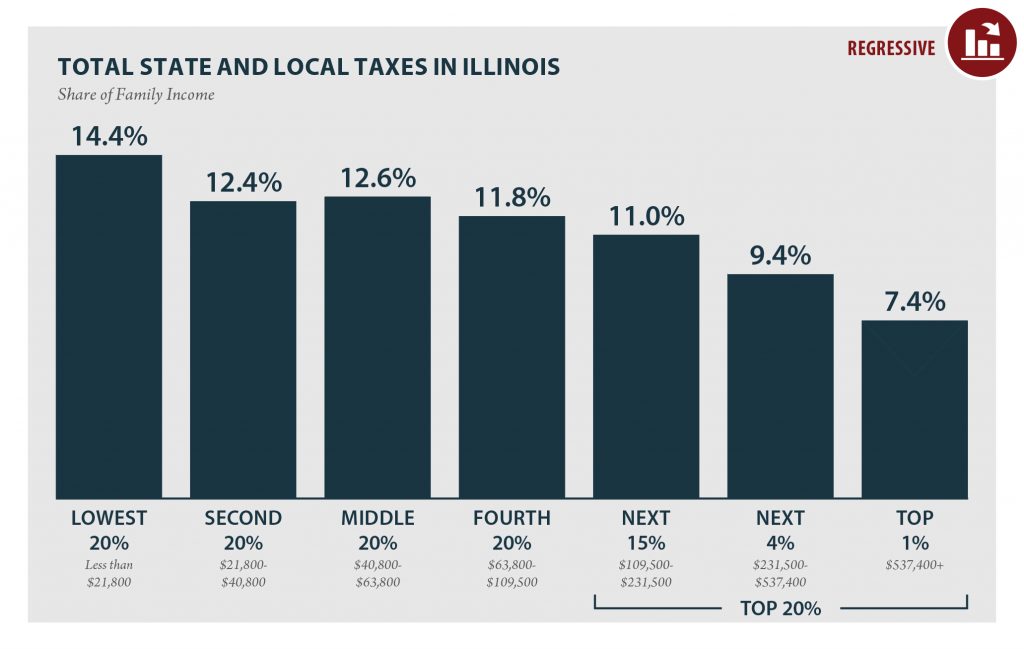
ILLINOIS Read as PDF ILLINOIS STATE AND LOCAL TAXES Taxes as Share of Family Income Top 20% Income Group Lowest 20% Second 20% Middle 20% Fourth 20% Next 15% Next 4% Top 1% Income Range Less than $21,800 $21,800 to $40,800 $40,800 to $63,800 $63,800 to $109,500 $109,500 to $231,500 $231,500 to $537,400 over $537,400 […]
Tennessee: Who Pays? 6th Edition
October 17, 2018 • By ITEP Staff
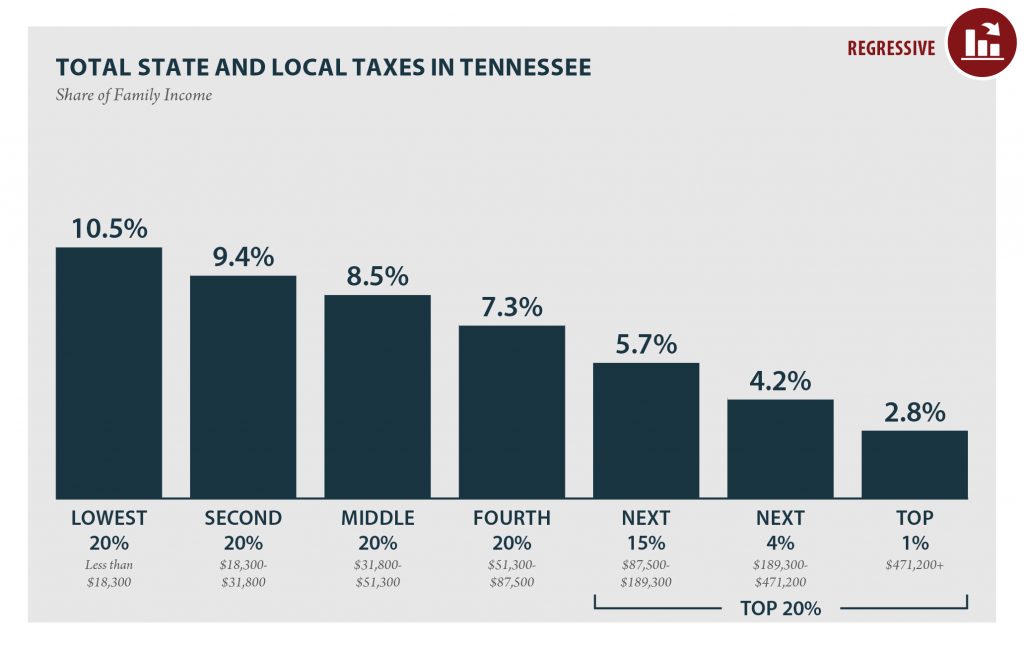
TENNESSEE Read as PDF TENNESSEE STATE AND LOCAL TAXES Taxes as Share of Family Income Top 20% Income Group Lowest 20% Second 20% Middle 20% Fourth 20% Next 15% Next 4% Top 1% Income Range Less than $18,300 $18,300 to $31,800 $31,800 to $51,300 $51,300 to $87,500 $87,500 to $189,300 $189,300 to $471,200 over $471,200 […]
Florida: Who Pays? 6th Edition
October 17, 2018 • By ITEP Staff
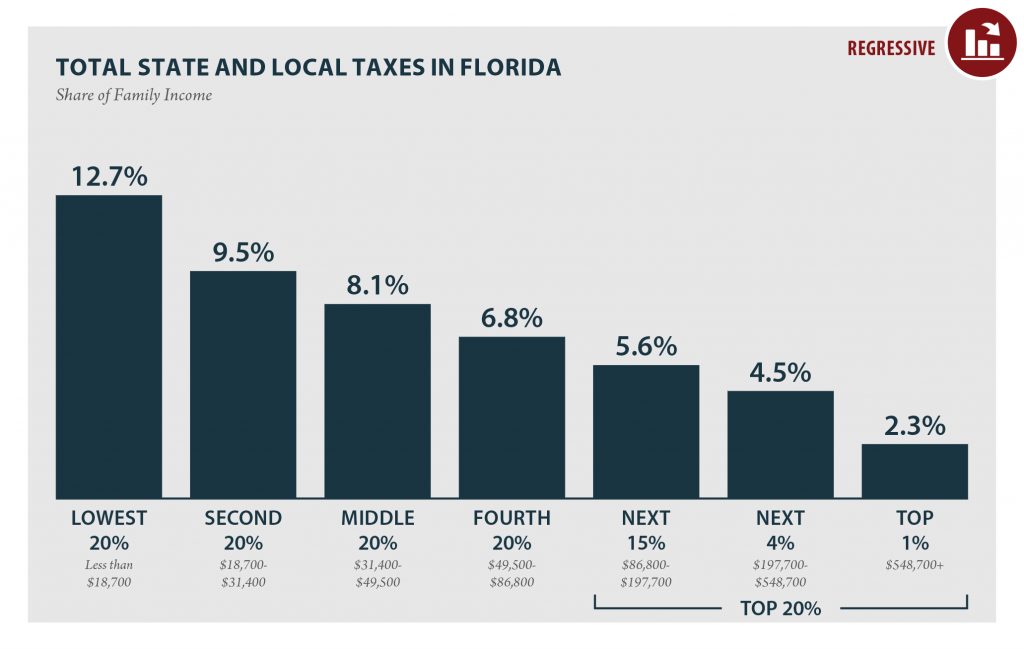
FLORIDA Read as PDF FLORIDA STATE AND LOCAL TAXES Taxes as Share of Family Income Top 20% Income Group Lowest 20% Second 20% Middle 20% Fourth 20% Next 15% Next 4% Top 1% Income Range Less than $18,700 $18,700 to $31,400 $31,400 to $49,500 $49,500 to $86,800 $86,800 to $197,700 $197,700 to $548,700 over $548,700 […]
New Hampshire: Who Pays? 6th Edition
October 17, 2018 • By ITEP Staff
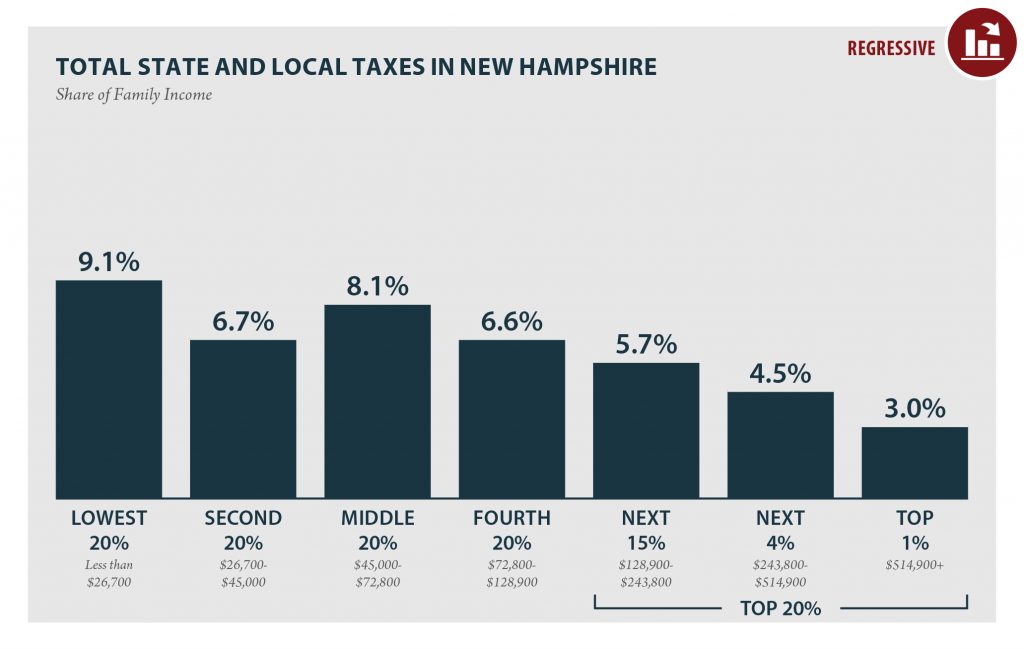
According to ITEP’s Tax Inequality Index, New Hampshire has the 16th most unfair state and local tax system in the country. Incomes are more unequal in New Hampshire after state and local taxes are collected than before.
Alabama: Who Pays? 6th Edition
October 17, 2018 • By ITEP Staff
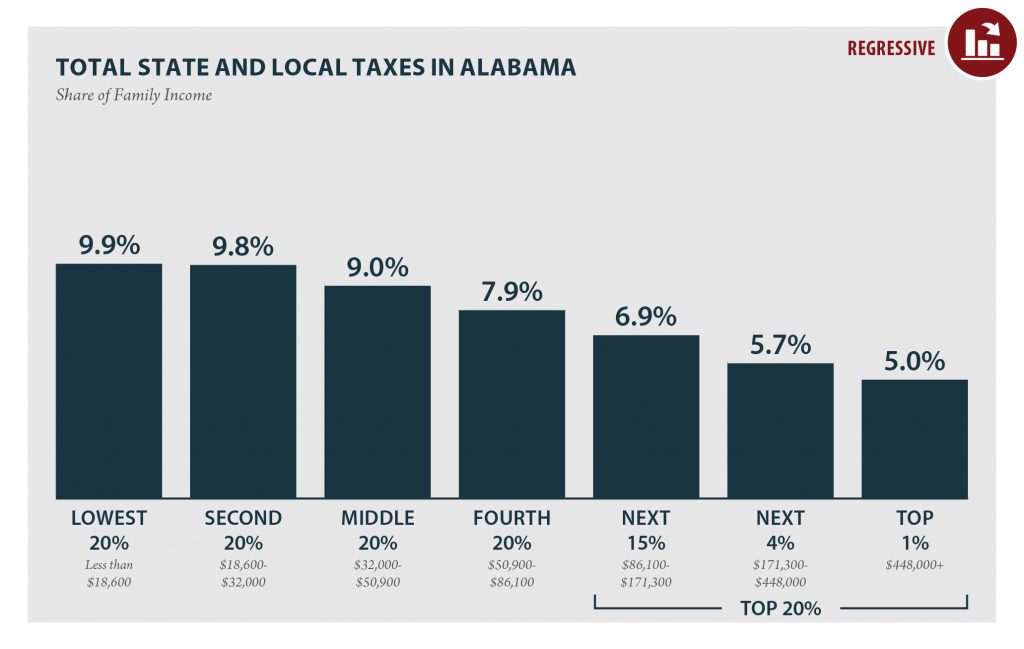
ALABAMA Read as PDF ALABAMA STATE AND LOCAL TAXES Taxes as Share of Family Income Top 20% Income Group Lowest 20% Second 20% Middle 20% Fourth 20% Next 15% Next 4% Top 1% Income Range Less than $18,600 $18,600 – $32,000 $32,000 – $50,900 $50,900 – $86,100 $86,100 – $171,300 $171,300 – $448,000 More than […]
Oklahoma: Who Pays? 6th Edition
October 17, 2018 • By ITEP Staff
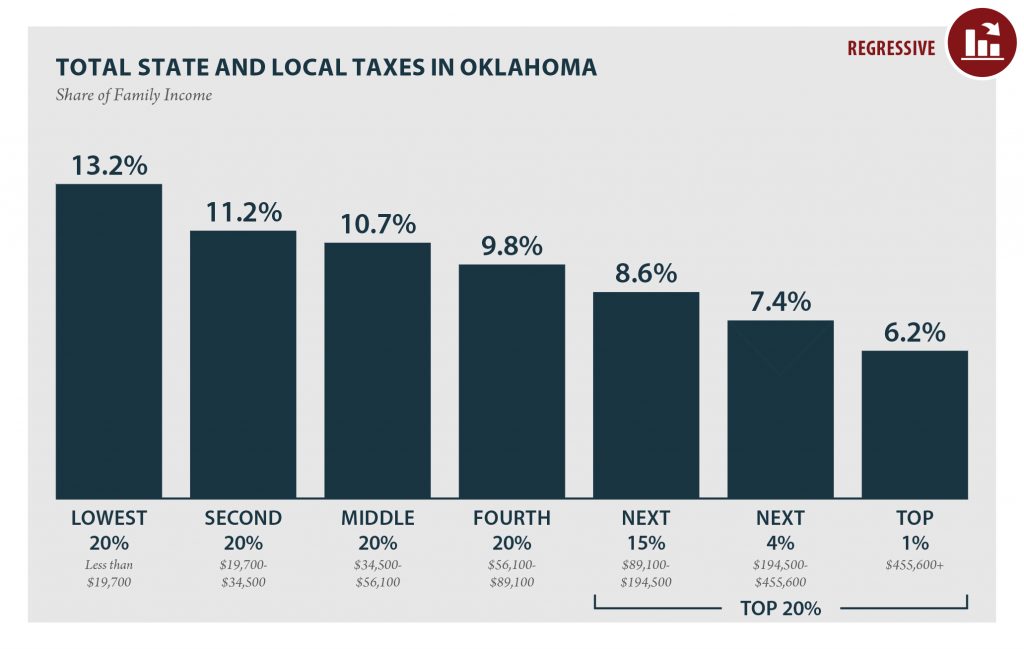
According to ITEP’s Tax Inequality Index, which measures the impact of each state’s tax system on income inequality, Oklahoma has the 9th most unfair state and local tax system in the country. Incomes are more unequal in Oklahoma after state and local taxes are collected than before.
Utah: Who Pays? 6th Edition
October 17, 2018 • By ITEP Staff
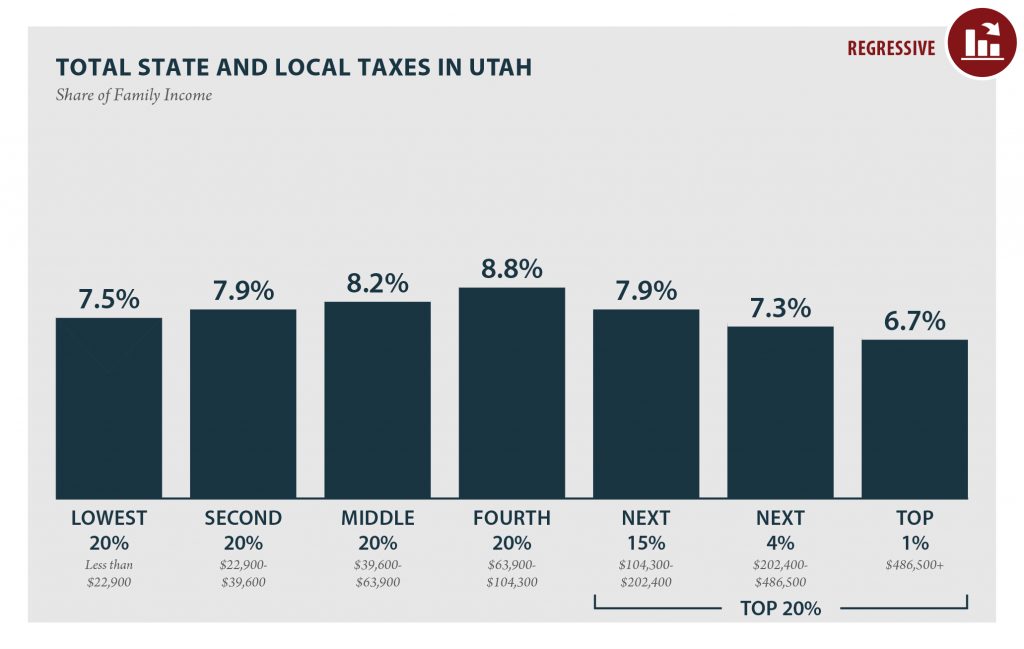
UTAH Read as PDF UTAH STATE AND LOCAL TAXES Taxes as Share of Family Income Top 20% Income Group Lowest 20% Second 20% Middle 20% Fourth 20% Next 15% Next 4% Top 1% Income Range Less than $22,900 $22,900 to $39,600 $39,600 to $63,900 $63,900 to $104,300 $104,300 to $202,400 $202,400 to $486,500 over $486,500 […]
Massachusetts: Who Pays? 6th Edition
October 17, 2018 • By ITEP Staff
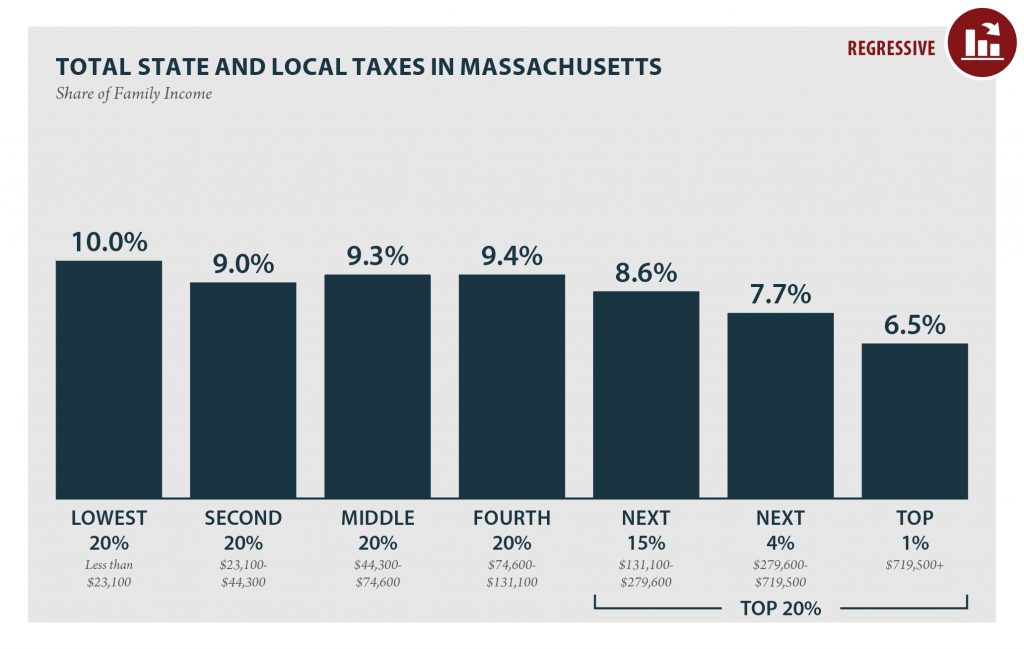
MASSACHUSETTS Read as PDF MASSACHUSETTS STATE AND LOCAL TAXES Taxes as Share of Family Income Top 20% Income Group Lowest 20% Second 20% Middle 20% Fourth 20% Next 15% Next 4% Top 1% Income Range Less than $23,100 $23,100 to $44,300 $44,300 to $74,600 $74,600 to $131,100 $131,100 to $279,600 $279,600 to $719,500 over $719,500 […]
Nebraska: Who Pays? 6th Edition
October 17, 2018 • By ITEP Staff
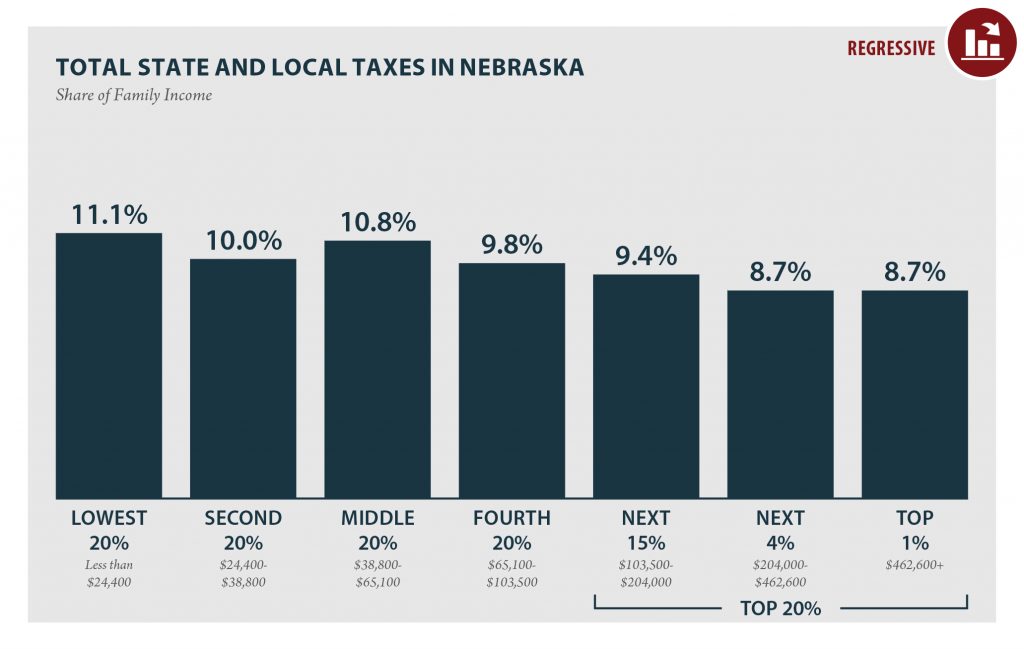
NEBRASKA Read as PDF NEBRASKA STATE AND LOCAL TAXES Taxes as Share of Family Income Top 20% Income Group Lowest 20% Second 20% Middle 20% Fourth 20% Next 15% Next 4% Top 1% Income Range Less than $24,400 $24,400 to $38,800 $38,800 to $65,100 $65,100 to $103,500 $103,500 to $204,000 $204,000 to $462,600 over $462,600 […]
Minnesota: Who Pays? 6th Edition
October 17, 2018 • By ITEP Staff
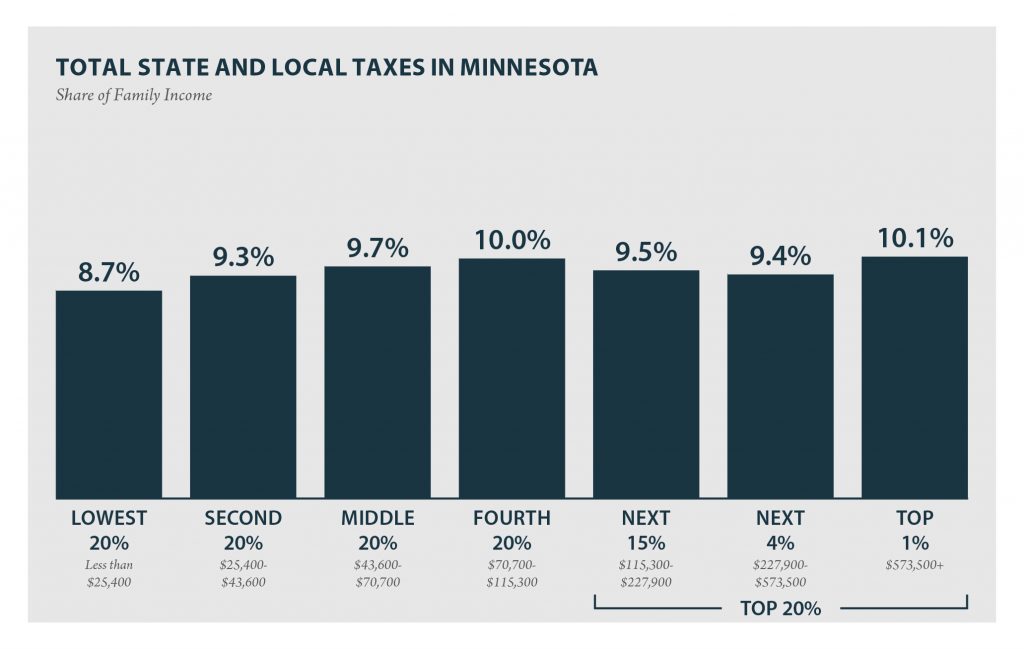
MINNESOTA Read as PDF MINNESOTA STATE AND LOCAL TAXES Taxes as Share of Family Income Top 20% Income Group Lowest 20% Second 20% Middle 20% Fourth 20% Next 15% Next 4% Top 1% Income Range Less than $25,400 $25,400 to $43,600 $43,600 to $70,700 $70,700 to $115,300 $115,300 to $227,900 $227,900 to $573,500 over $573,500 […]
Wyoming: Who Pays? 6th Edition
October 17, 2018 • By ITEP Staff
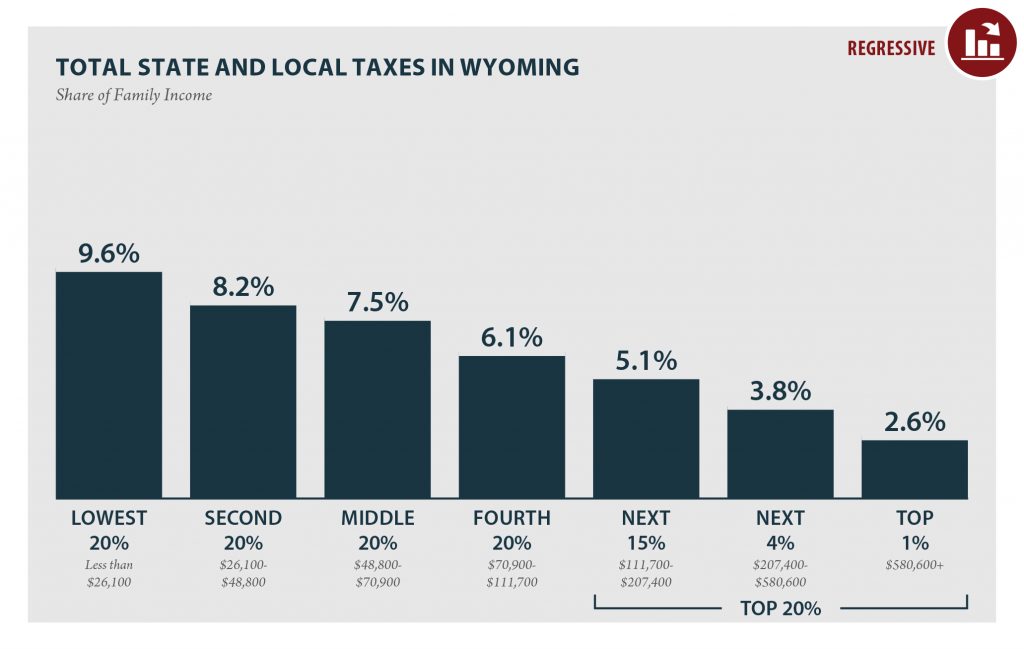
WYOMING Read as PDF WYOMING STATE AND LOCAL TAXES Taxes as Share of Family Income Top 20% Income Group Lowest 20% Second 20% Middle 20% Fourth 20% Next 15% Next 4% Top 1% Income Range Less than $26,100 $26,100 to $48,800 $48,800 to $70,900 $70,900 to $111,700 $111,700 to $207,400 $207,400 to $580,600 over $580,600 […]
Iowa: Who Pays? 6th Edition
October 17, 2018 • By ITEP Staff
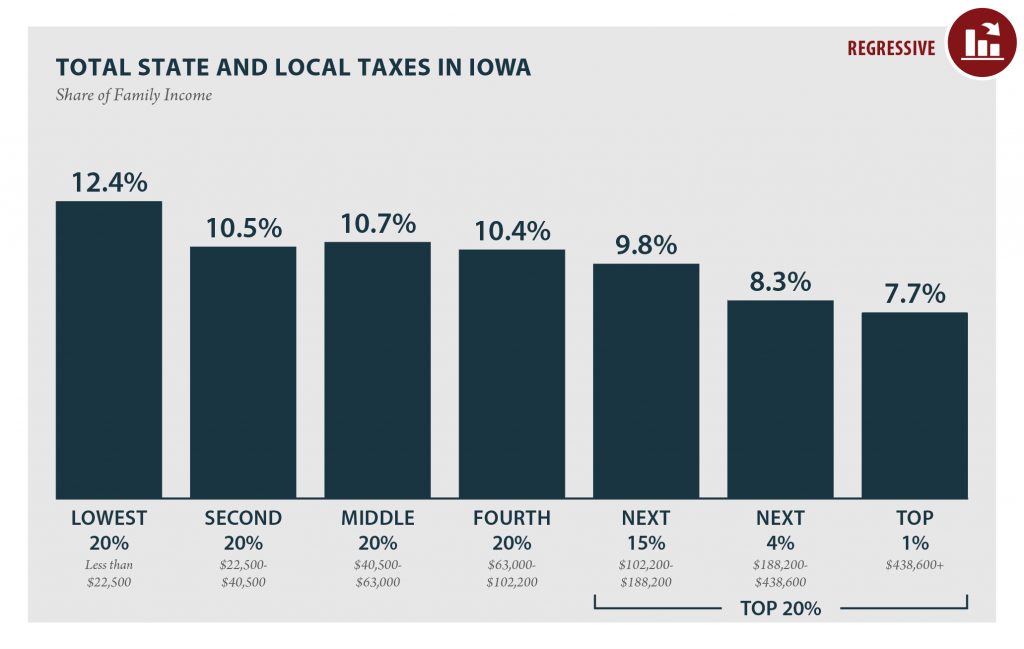
IOWA Read as PDF IOWA STATE AND LOCAL TAXES Taxes as Share of Family Income Top 20% Income Group Lowest 20% Second 20% Middle 20% Fourth 20% Next 15% Next 4% Top 1% Income Range Less than $22,500 $22,500 to $40,500 $40,500 to $63,000 $63,000 to $102,200 $102,200 to $188,200 $188,200 to $438,600 over $438,600 […]

Institute on Taxation
and Economic Policy
ITEP is a non-profit, non-partisan tax policy organization. We conduct rigorous analyses of tax and economic proposals and provide data-driven recommendations to shape equitable and sustainable tax systems.
Subscribe to ITEP Emails
Tax research and policy news in your inbox.
Promote Fair Tax Policy
Your gift to ITEP promotes tax justice. With your help, we do research that supports taxing millionaires and billionaires, taxing big corporations and raising revenue for the things our people, our communities and our planet need.
Together, we can create a country with more economic justice, more racial justice, more climate justice… and more tax justice.