Recent Work
2185 items
Congressional Research Service Calls Three Strikes on the Trump Tax Cuts
May 30, 2019 • By Matthew Gardner

This new report is the most comprehensive assessment yet undertaken by the CRS, which has an unimpeachable reputation as an impartial arbiter of policy disputes. So, when it says that the TCJA doesn’t appear to have grown wages or the economy and has made our long-term budget deficits even worse, it’s a judgment that will last.
Like certain recent controversially concluded television shows, tax and budget debates can end in many ways and often receive mixed reviews. Illinois leaders, for example, ended on a cliffhanger by approving a historic constitutional amendment to create a graduated income tax in the state, whose ultimate conclusion will be crowdsourced by voters next November. Arizona’s fiscal finale fell flat with many observers due to corner-cutting on needed investments and a heavy focus on tax cuts. Texas legislators went for crowd-pleasing property tax cuts and school funding increases but left a gigantic “but how will we pay for this” plot hole…
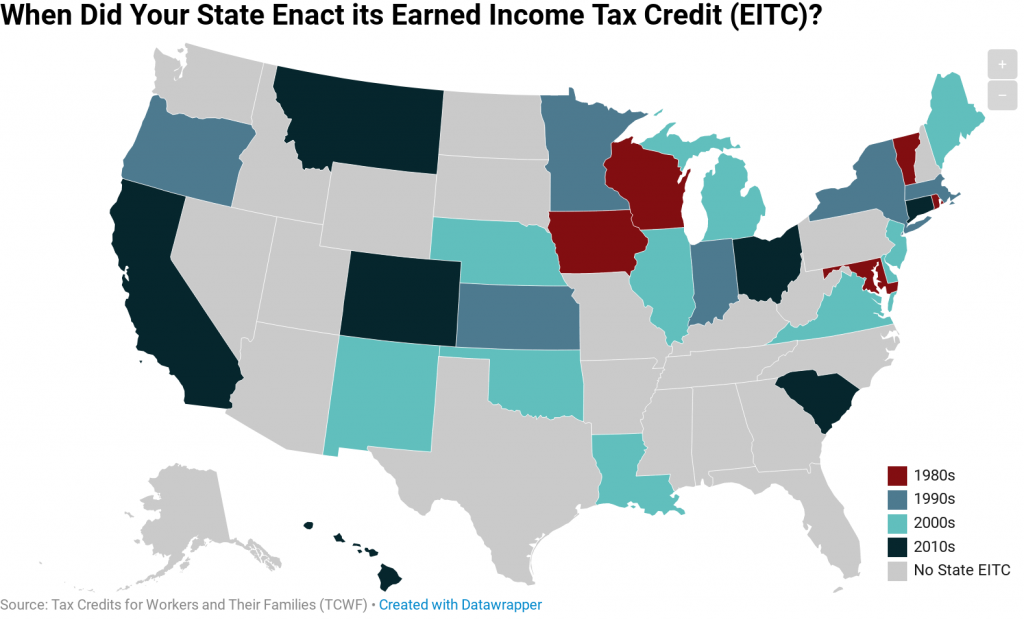
In 1986, Rhode Island became the first state to enact a tax credit patterned after the federal Earned Income Tax Credit (EITC). Since then, EITCs have become increasingly widespread at the state level with 28 states and the District of Columbia now offering them. These credits are designed to improve family economic security by bolstering […]
Unlike Trump-GOP Tax Law, There Are Tax Plans That Would Actually Deliver on Promise to Help Working People
May 24, 2019 • By Alan Essig

Using the tax code to boost the economic security of low- and moderate-income families is a proven strategy. These bold proposals would go much further than any policy currently on the books, and their approach directly contrasts with longstanding supply-side theories that call for continual tax cuts to those who are already economically faring far better than everyone else.
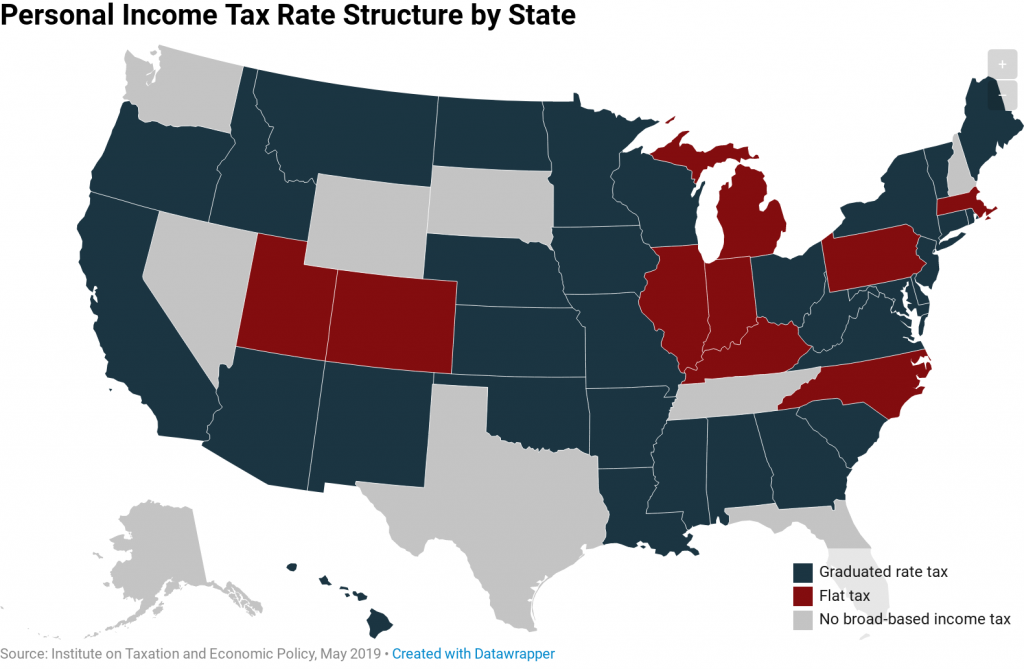
One of the most important decisions that must be made when designing a state personal income tax is whether to charge taxpayers a single flat rate on all their taxable income, or whether to levy a series of graduated rates that ask more of high-income taxpayers
State Rundown 5/22: (Some) State Lawmakers Can (Partly) Relax This Weekend
May 22, 2019 • By ITEP Staff
Lawmakers and advocates can enjoy their barbeques with only one eye on their work email this weekend in states that have essentially finished their budget debates such as Alaska, Minnesota, Nebraska, and Oklahoma, though both Alaska and Minnesota require special sessions to wrap things up. Getting to those barbeques may be a bumpy ride in Louisiana, Michigan, and other states still working to modernize outdated and inadequate gas taxes.
Proposals for Refundable Tax Credits Are Light Years from Tax Policies Enacted in Recent Years
May 22, 2019 • By Steve Wamhoff
A new ITEP report examines five big proposals that have been announced this year to create or expand tax credits to address inequality and help low- and middle-income households.
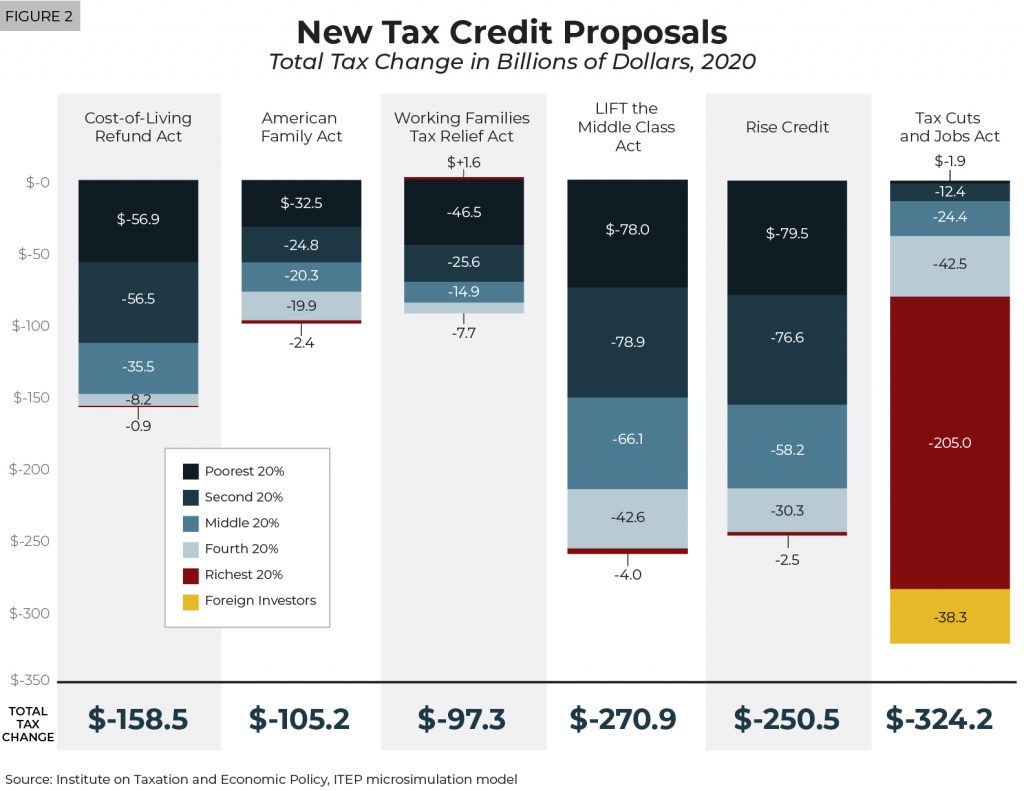
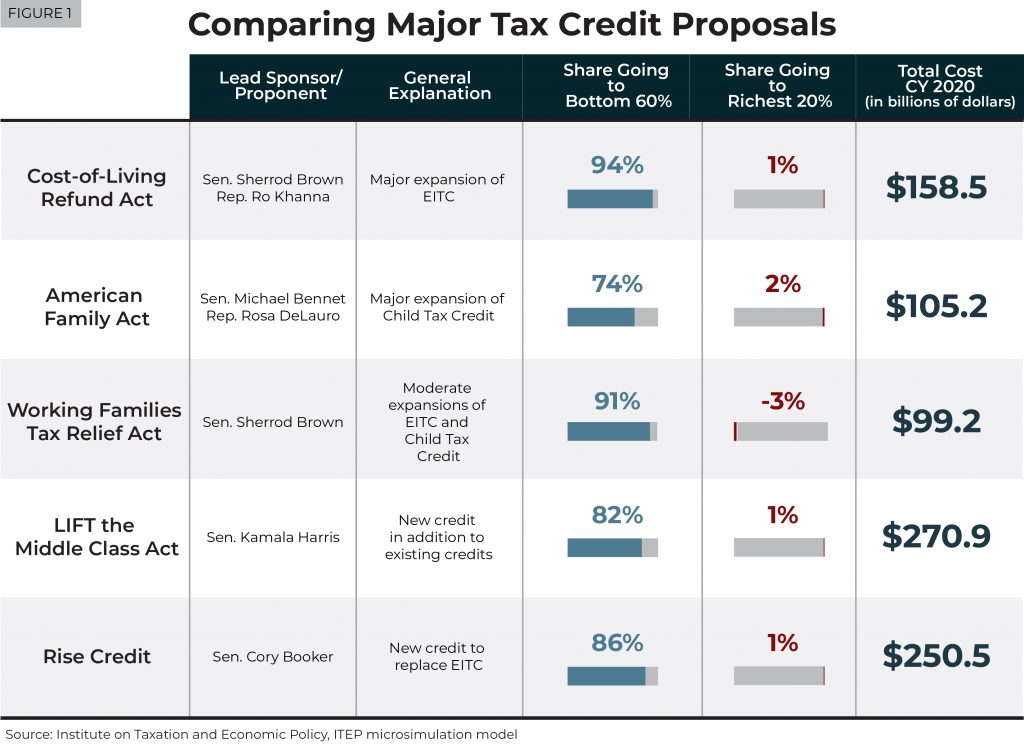
Federal lawmakers have recently announced at least five proposals to significantly expand existing tax credits or create new ones to benefit low- and moderate-income people. While these proposals vary a great deal and take different approaches, all would primarily benefit taxpayers who received only a small share of benefits from the Tax Cuts and Jobs Act.
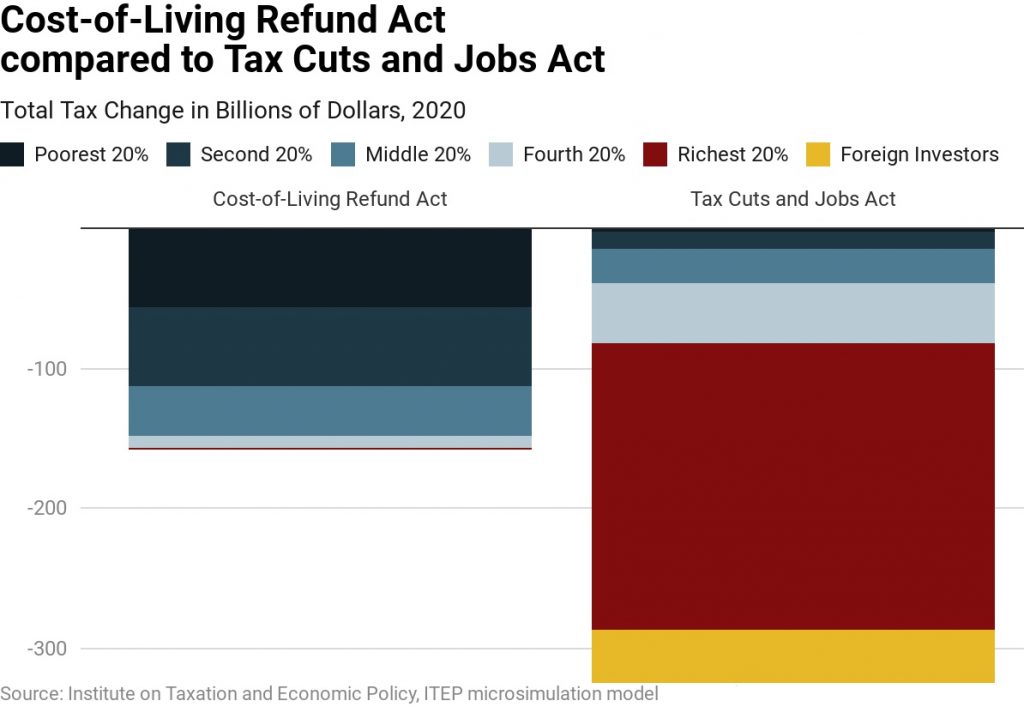
The Cost-of-Living Refund Act would expand the Earned Income Tax Credit (EITC) for low- and moderate-income working people. The maximum EITC would nearly double for working families with children. Working people without children would receive an EITC that is nearly six times the size of the small EITC that they are allowed under current law.

The American Family Act would expand the Child Tax Credit (CTC) for low- and middle-income families. The CTC would increase from $2,000 under current law to $3,000 for each child age six and older and to $3,600 for each child younger than age six. The proposal removes limits on the refundable part of the credit so that low- and moderate-income families with children could receive the entire credit.
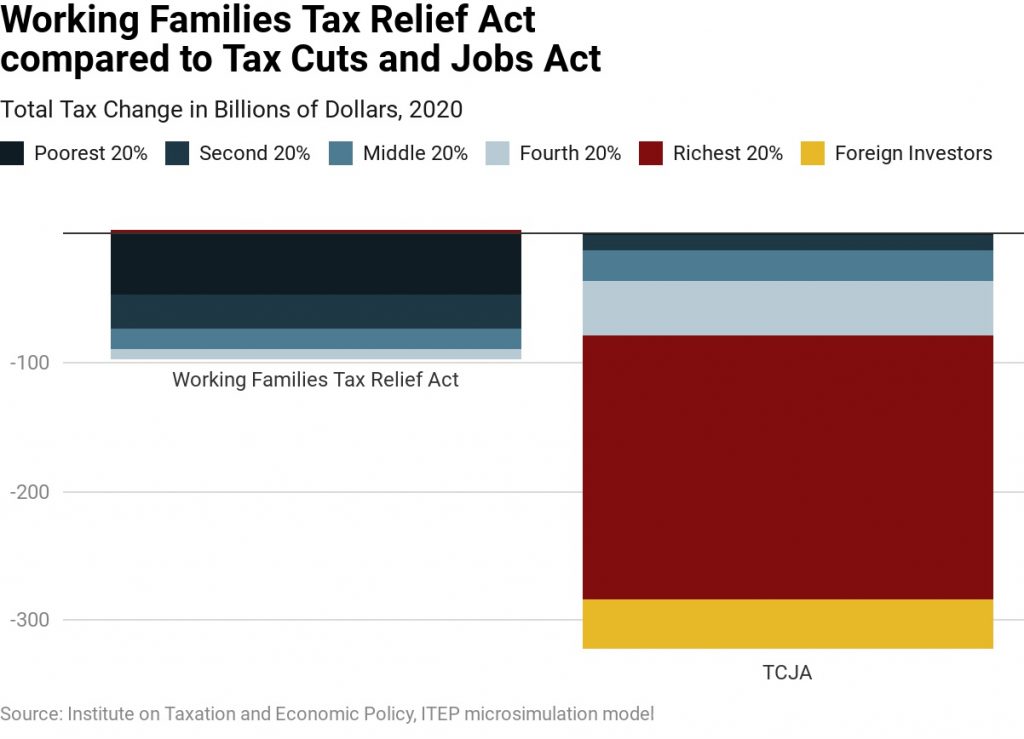
The Working Families Tax Relief Act would expand the Earned Income Tax Credit (EITC) and the Child Tax Credit (CTC) for low- and middle-income families.
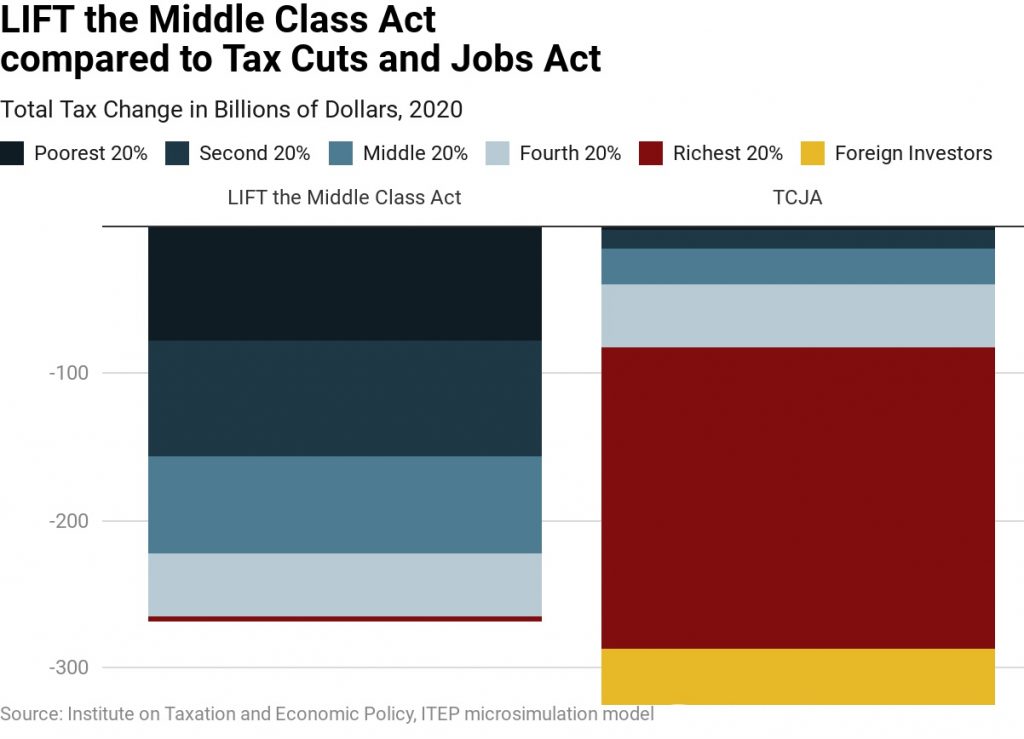
The LIFT (Livable Incomes for Families Today) the Middle Class Act would create a new tax credit of up to $3,000 for single people and up to $6,000 for married couples, which would be an addition to existing tax credits. Eligible taxpayers would be allowed a credit equal to the maximum amount or their earnings, whichever is less. Income limits would prevent well-off households from receiving the credit.
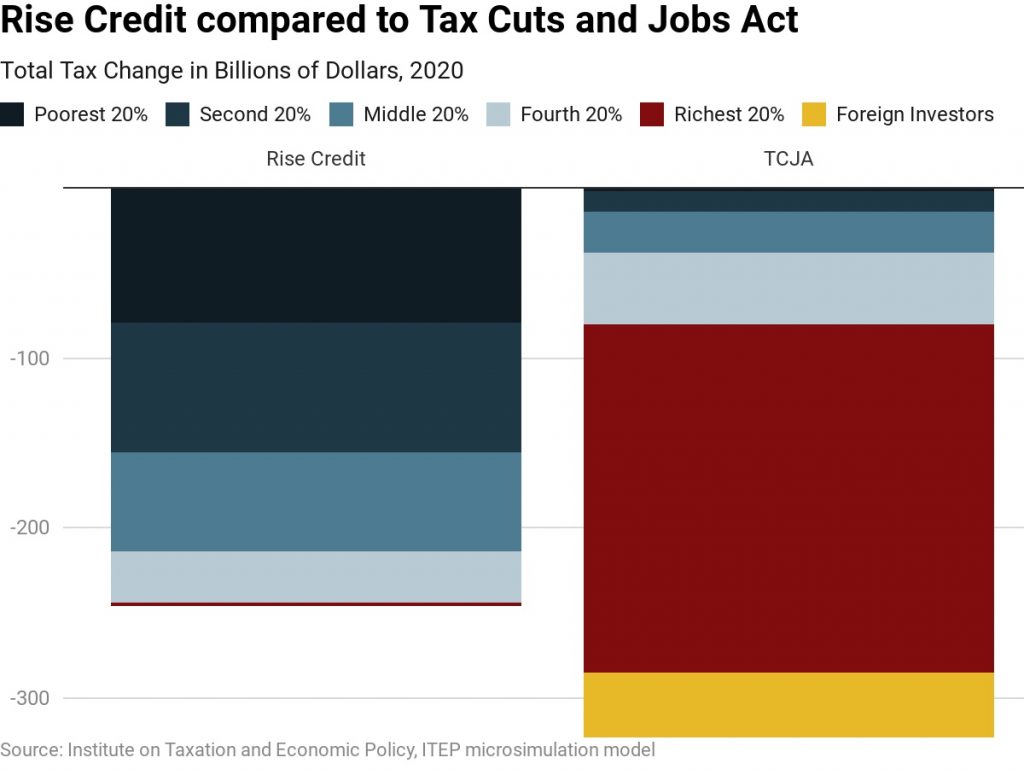
The Rise Credit would replace the existing EITC. In most cases, the Rise Credit would be $4,000 for single people and $8,000 for married couples. Eligible taxpayers would be allowed a credit equal to the maximum amount or their earnings, whichever is less.
Gas Taxes Have Gone Up in Most States, but Decades-Long Procrastinators Remain
May 21, 2019 • By Carl Davis

The upcoming Memorial Day weekend marks the start of the traditional summer driving season. In most states, summer road-trippers are paying more gas tax than they did a few years ago and are benefiting from smoother and safer roads as a result. In total, 30 states have raised or reformed their gas taxes in the last six years.
These States Abandoned Old Gas Tax Structures in Favor of More Sustainable Variable-Rate Gas Taxes
May 20, 2019 • By ITEP Staff
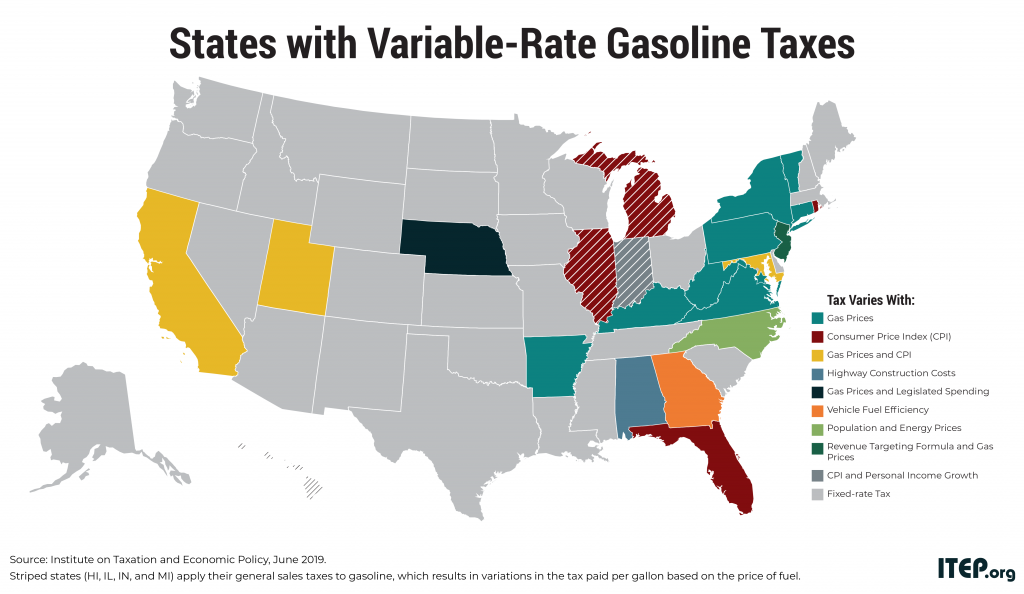
Because of these reforms, more than 193 million people (or 59 percent of the U.S. population) now live in places where the state gas tax rate automatically varies over time.

Institute on Taxation
and Economic Policy
ITEP is a non-profit, non-partisan tax policy organization. We conduct rigorous analyses of tax and economic proposals and provide data-driven recommendations to shape equitable and sustainable tax systems.
Subscribe to ITEP Emails
Tax research and policy news in your inbox.
Promote Fair Tax Policy
Your gift to ITEP promotes tax justice. With your help, we do research that supports taxing millionaires and billionaires, taxing big corporations and raising revenue for the things our people, our communities and our planet need.
Together, we can create a country with more economic justice, more racial justice, more climate justice… and more tax justice.