Recent Work
2185 items
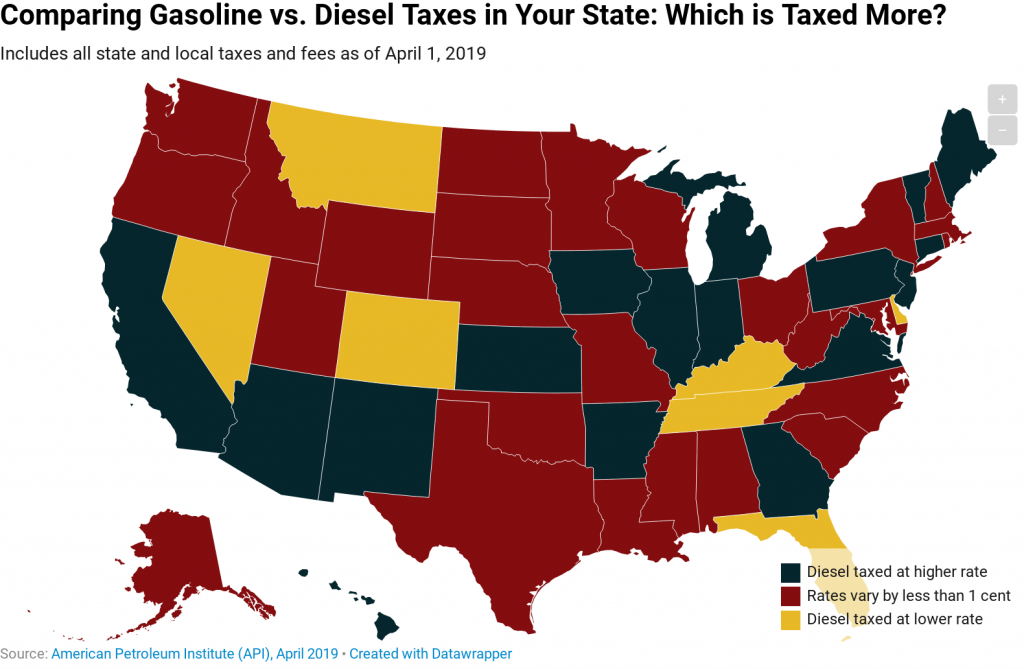
Twenty-six states and the District of Columbia tax these two fuel types at the same rate or very similar rates, as of April 2019, according to data from the American Petroleum Institute.
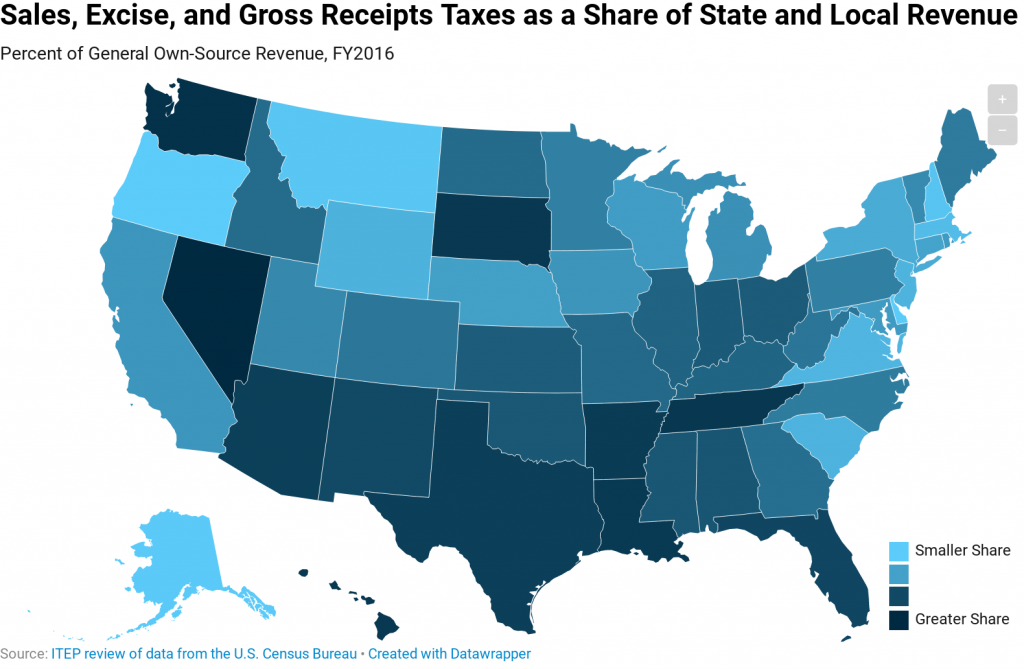
Consumption taxes (including general sales taxes, excise taxes on specific products, and gross receipts taxes) are an important revenue source for state and local governments. While five states lack state-level general sales taxes (Alaska, Delaware, Montana, New Hampshire, and Oregon), every state levies taxes on some types of consumption.
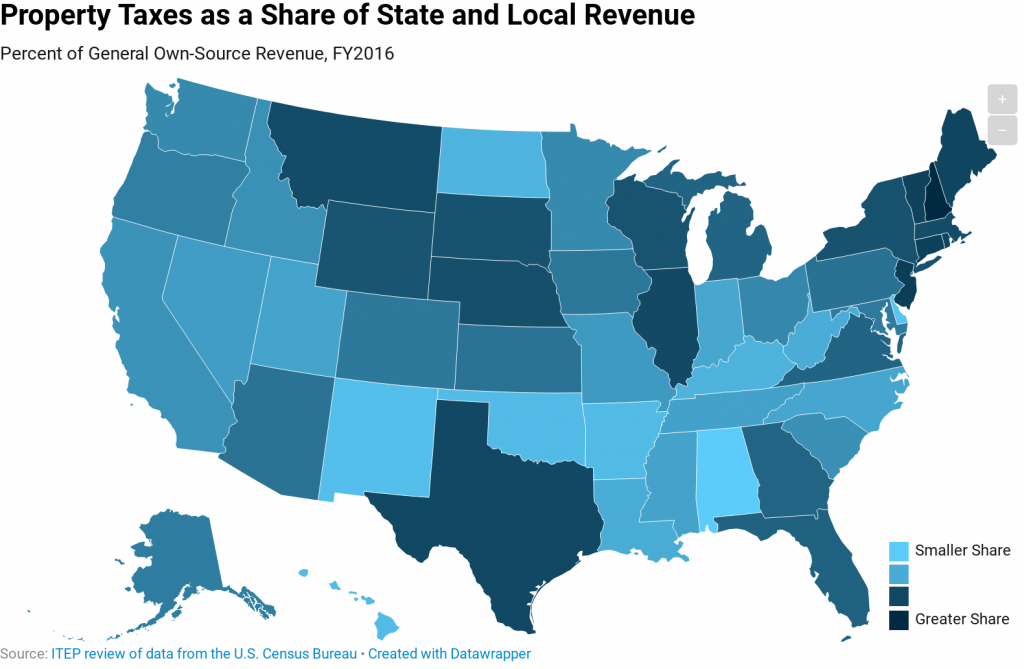
The property tax is the oldest major revenue source for state and local governments and remains an important mechanism for funding education and other local services. This map shows the share of state and local general revenue in each state that is raised through property taxes.
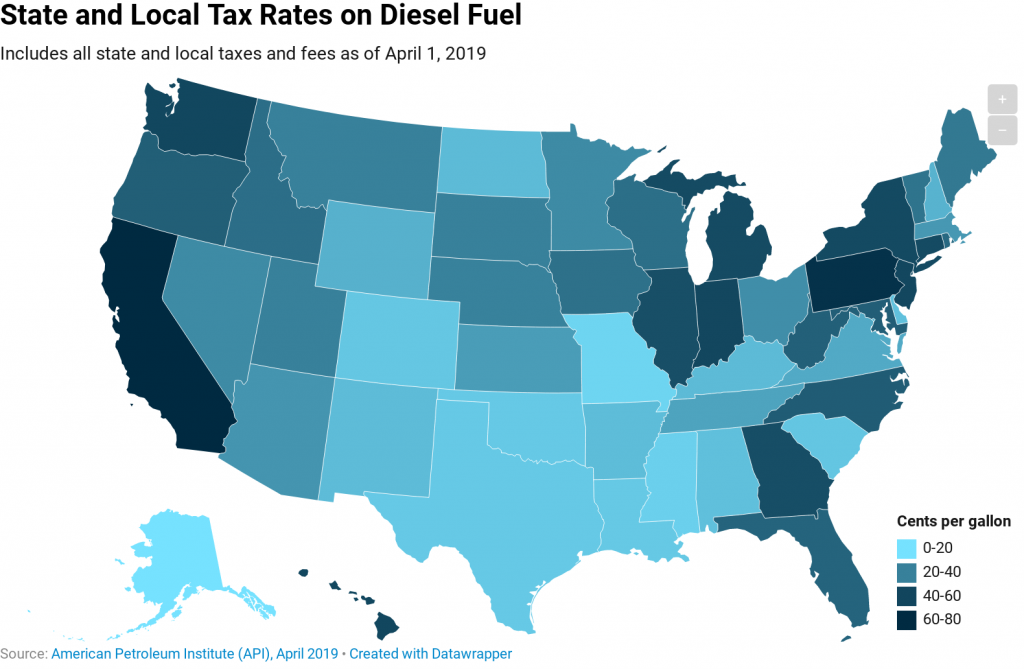
The tax rates identified in this map include state and local excise and sales taxes on diesel fuel, as well as various fees, as calculated by the American Petroleum Institute (API). These taxes are levied in addition to the federal government’s 24.4-cent-per-gallon diesel tax.
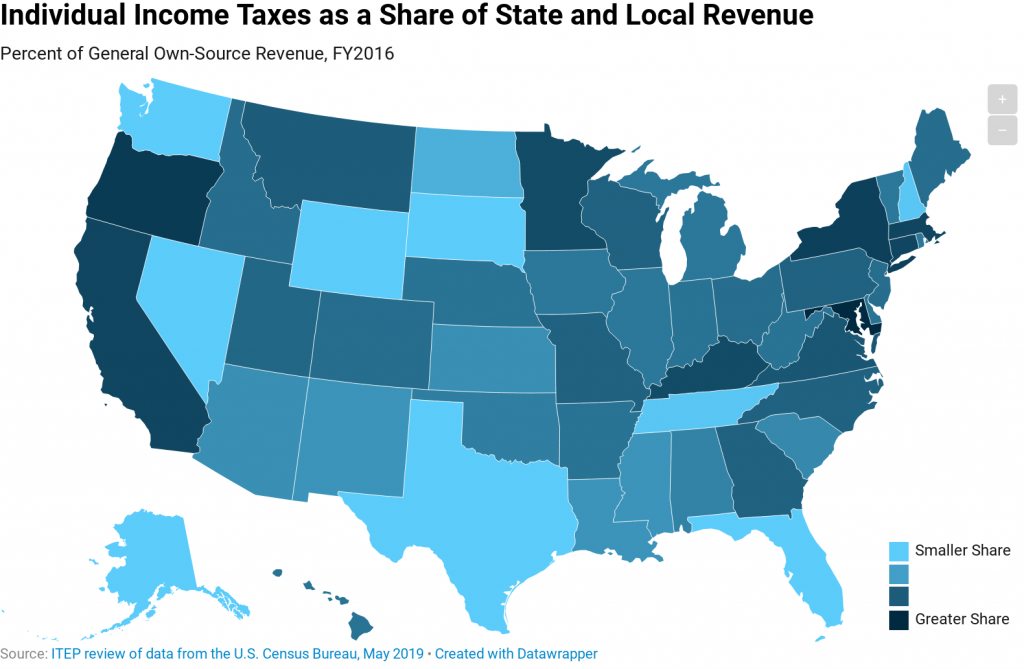
Income taxes vary considerably in their structure across states, though the best taxes are fine-tuned to taxpayers’ ability-to-pay.
Policymakers and the public widely agree that economic inequality is the social policy problem of our age. It threatens the livelihoods of millions of children and adults, and it even threatens our democracy. Although some say Americans could fix it themselves by simply rolling up their sleeves, as a sub-headline in a March U.S. News and World Report column implied, the reality is different.
State Rundown 5/16: Tensions Remain High Over Budgets and School Finances in Several States
May 16, 2019 • By ITEP Staff
Tax and budget negotiations remain at standstills in Louisiana and Minnesota, as school funding debates and teacher protests again captured headlines in several states. Oregon lawmakers, for example, finally passed a mixed-bag tax package that won’t improve tax equity but will raise much-needed revenue for education. Meanwhile their counterparts in Nebraska continue to debate highly […]
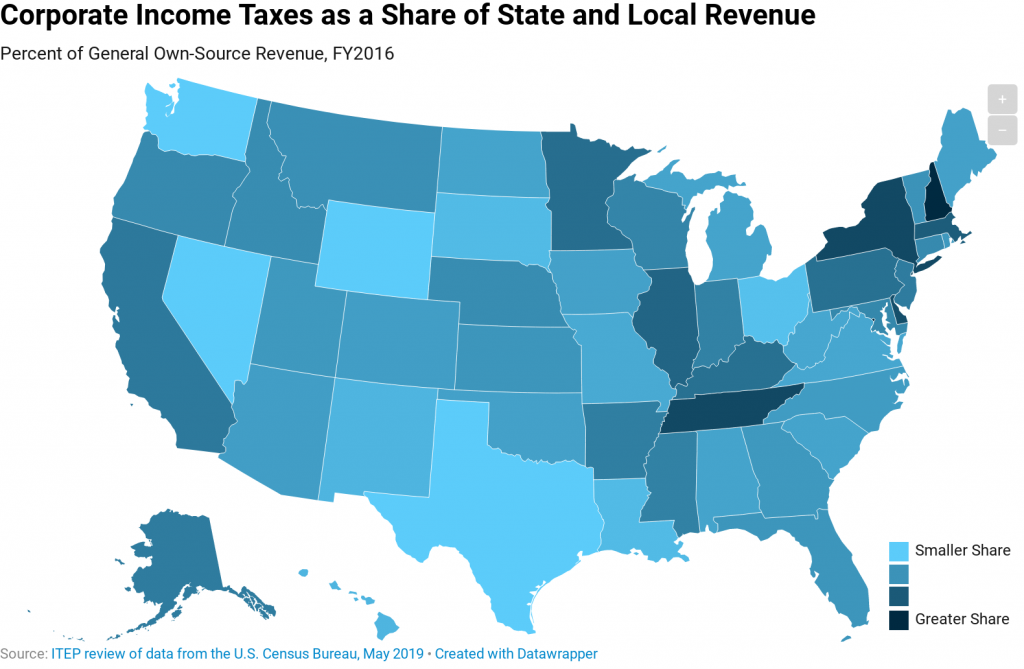
Corporate income taxes are an important source of revenue for state governments and ensure that profitable corporations benefiting from public services pay toward the maintenance of those services.
Presentation: NCSL Task Force on State and Local Taxation, Taxing Cannabis
May 10, 2019 • By Carl Davis
ITEP Research Director Carl Davis presented to the National Conference of State Legislatures (NCSL) Task Force on State and Local Taxation on approaches to cannabis taxation and the recent report Taxing Cannabis.
State Rundown 5/9: Illinois Moves Closer to a Progressive Income Tax
May 9, 2019 • By ITEP Staff
Lawmakers in Illinois and Ohio have advanced major tax proposals but cannot rest just yet, as they must still get past the other legislative chamber. Their counterparts in Michigan, Minnesota, Nebraska, and Oregon, meanwhile, are all at impasses over education funding, as those in Texas left their school funding disagreement unresolved at least until they reconvene...in 2021. And in an era of many states pre-empting smaller jurisdictions by revoking local decision-making powers, leaders in Colorado and Delaware made moves in the opposite direction, entrusting cities and school districts with more local control.
Proponents of Trump Tax Law Cite ITEP with Obvious Lack of Context
May 6, 2019 • By Steve Wamhoff
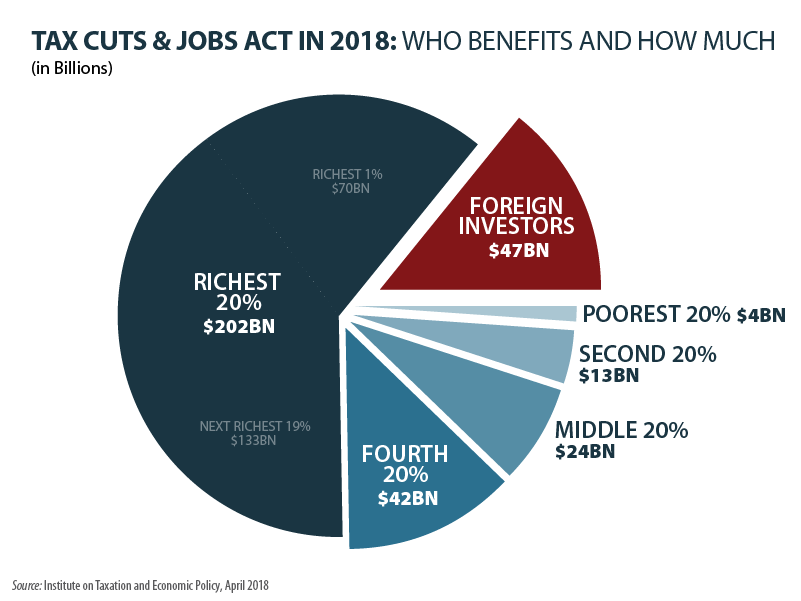
Sen. Chuck Grassley, the chairman of the Senate Finance Committee, today has an op-ed defending Trump-GOP tax law. “One of the most-covered falsehoods being spread about tax reform,” as he calls the law, “is that it’s a middle-class tax hike.” He cites ITEP’s estimates to back up his point that most people in every income group have lower taxes because of the law. As Sen. Grassley and his staff know full well, this leaves out the important point of our findings.
Teachers in North Carolina and South Carolina are walking out and rallying this week for increased education funding, teacher and staff pay, and other improvements to benefit students—if you’re unsure why be sure to check out research on the teacher shortage and pay gap under “What We’re Reading” below. Meanwhile, budget debates have recently wrapped up in Indiana, Iowa, Massachusetts, New Hampshire, and Washington. And major tax debates are kicking into high gear in both Louisiana and Nebraska.
ITEP Testimony Supporting H.B. No. 7415, An Act Concerning a Surcharge on Capital Gains
April 26, 2019 • By Aidan Davis
Comments are intended to offer some perspective on the broader tax policy context in which this proposal is being considered. We find that this proposal would help to lessen long-running inequities in Connecticut’s state and local tax law that have allowed high-income taxpayers to pay lower overall effective tax rates than most low- and middle-income families.
State Rundown 4/26: Capital Gains Taxes Make Gains and Regressive Proposals Regress
April 26, 2019 • By ITEP Staff
Progressive capital gains tax proposals made news this week in Connecticut and Massachusetts, while Nebraskans came out in force to oppose a regressive tax shift, and North Carolina teachers prepare to rally over their legislature’s proclivity to cut taxes on wealthy households while underfunding schools.
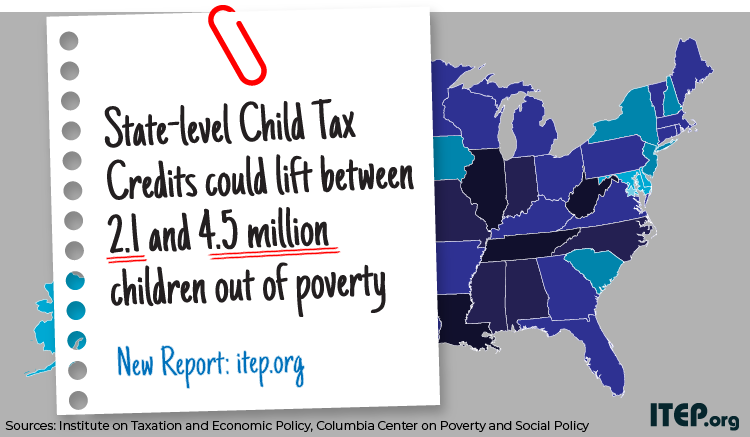
From the first comprehensive look at corporate filings under the 2017 tax law to bold policy options from analysts and researchers to dramatically reduce poverty, here’s a summary of reports that ITEP released this month.

Institute on Taxation
and Economic Policy
ITEP is a non-profit, non-partisan tax policy organization. We conduct rigorous analyses of tax and economic proposals and provide data-driven recommendations to shape equitable and sustainable tax systems.
Subscribe to ITEP Emails
Tax research and policy news in your inbox.
Promote Fair Tax Policy
Your gift to ITEP promotes tax justice. With your help, we do research that supports taxing millionaires and billionaires, taxing big corporations and raising revenue for the things our people, our communities and our planet need.
Together, we can create a country with more economic justice, more racial justice, more climate justice… and more tax justice.