Recent Work
2185 items

In early April, a diverse but mostly black crowd took to the streets in the Shaw neighborhood of Washington D.C. to protest T-Mobile’s decision to order Metro PCS to cease playing gogo music. This tale is a shining example of why economic investment—especially taxpayer-incentivized investment—in underserved communities is fraught with controversy. Who ultimately benefits after developers pour millions of dollars into these communities? And, as this controversy reveals, are the usually black and brown denizens of these neighborhoods and businesses that may have catered to them no longer welcome once economic development reaches a critical mass?
Tax and budget debates are now mostly complete in Alabama, Arkansas, and Colorado, but just starting or just getting interesting in several other states. Delaware and Massachusetts lawmakers, for example, are looking at progressive income tax increases on wealthy households, and New Hampshire may use a progressive tax on capital gains to simultaneously improve its upside-down tax code and invest in education. Nebraska and Texas, on the other hand, are also looking to improve school funding but plan to do so on the backs of low- and middle-income families through regressive sales tax increases. Fiscal debates are heating up in…
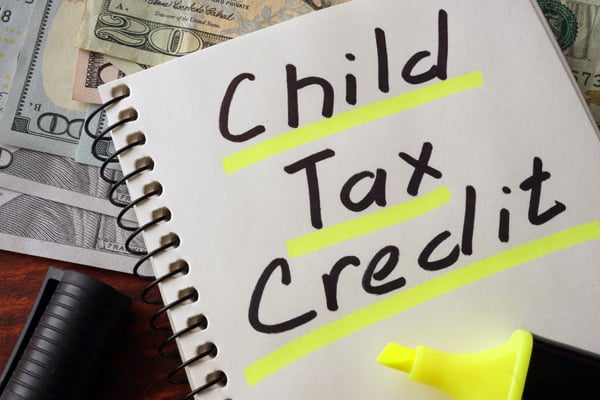
States Could Lift Millions of Children Out of Poverty by Enacting State-Level Child Tax Credits
April 17, 2019 • By Aidan Davis
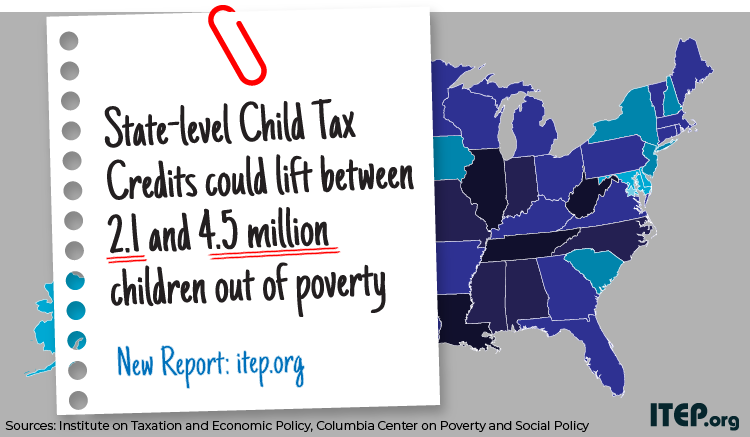
In a new 50-state analysis, ITEP and the Center on Poverty & Social Policy at Columbia University teamed up to explain how state-level Child Tax Credits (CTCs) could lift between 2.1 and 4.5 million children out of poverty. The report outlines options that would help families who received little to no benefit from the expansion of the federal CTC included in the 2017 Tax Cuts and Jobs Act.
The Case for Extending State-Level Child Tax Credits to Those Left Out: A 50-State Analysis
April 17, 2019 • By Aidan Davis, Meg Wiehe
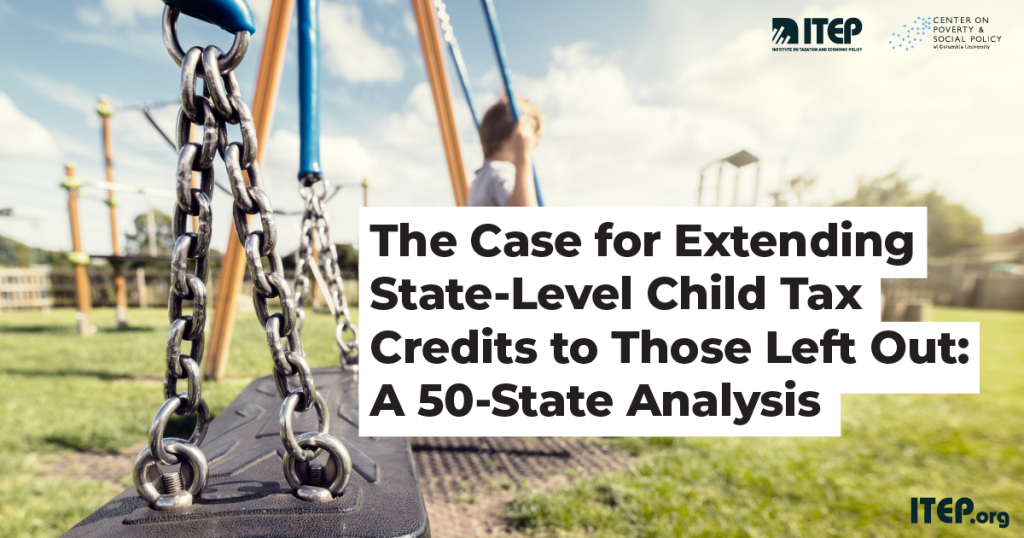
As of 2017, 11.5 million children in the United States were living in poverty. A national, fully-refundable Child Tax Credit (CTC) would effectively address persistently high child poverty rates at the national and state levels. The federal CTC in its current form falls short of achieving this goal due to its earnings requirement and lack of full refundability. Fortunately, states have options to make state-level improvements in the absence of federal policy change. A state-level CTC is a tool that states can employ to remedy inequalities created by the current structure of the federal CTC. State-level CTCs would significantly reduce…
For Tax Day, ITEP has released several new reports that tell a broad story about our nation’s federal, state and local tax systems, providing important details about taxes we all pay and research on the tax-paying habits of Fortune 500 corporations. And of course, we have a trove of other tax policy resources.
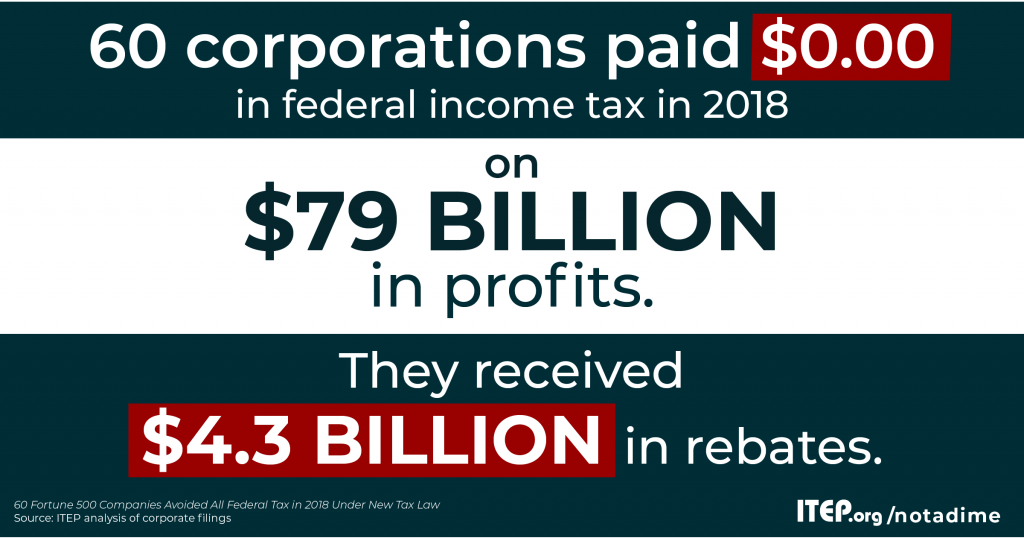
$4.3 Billion in Rebates, Zero-Tax Bill for 60 Profitable Corps Directly Related to Loopholes
April 12, 2019 • By Matthew Gardner

Meet the new corporate tax system, same as the old corporate tax system. That’s the inescapable conclusion of a new ITEP report assessing the taxpaying behavior of America’s most profitable corporations. The report, Corporate Tax Avoidance Remains Rampant Under New Law, released earlier this week, finds that 60 Fortune 500 corporations disclose paying zero in federal income taxes in 2018 despite enjoying large profits.
Income inequality is a national challenge. And inadequate federal revenue is a challenge that the nation will eventually have to reckon with. This chart book makes a strong case for why federal lawmakers should seriously consider progressive revenue-raising options.
The IRS Could Calculate Taxes for the Vast Majority of Taxpayers—But a Bipartisan Measure Would Ban It
April 12, 2019 • By Jessica Schieder
A proposal re-introduced this week by Sen. Elizabeth Warren (D-MA), Sen. Jeanne Shaheen (D-NH), and Rep. Brad Sherman (D-CA), The Tax Filing Simplification Act of 2019, goes a long way toward making tax filing a much more straight-forward process by broadening the IRS’s mandate.

The Montana Senate this week stopped a bill to restructure the state's temporary tribal tax exemption program, making tribal governments the only sovereignties on which Montana levies a tax and making it more difficult for leaders to buy back illegally seized land. Still, the success of the bill in the House is troubling.
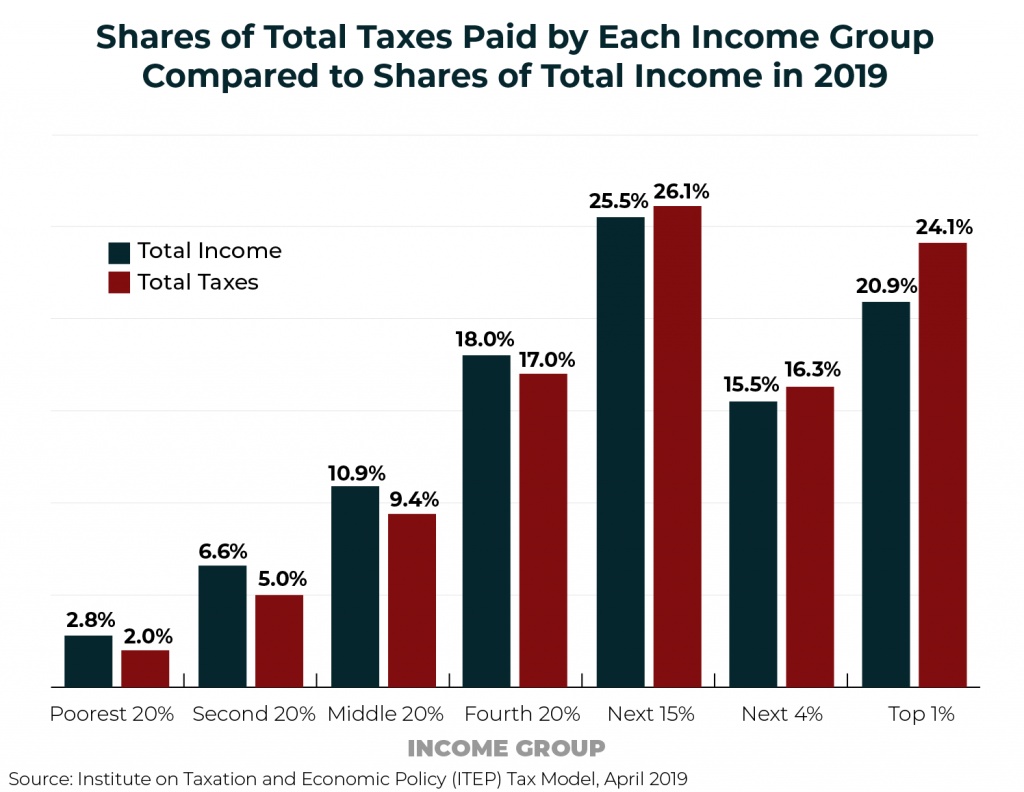
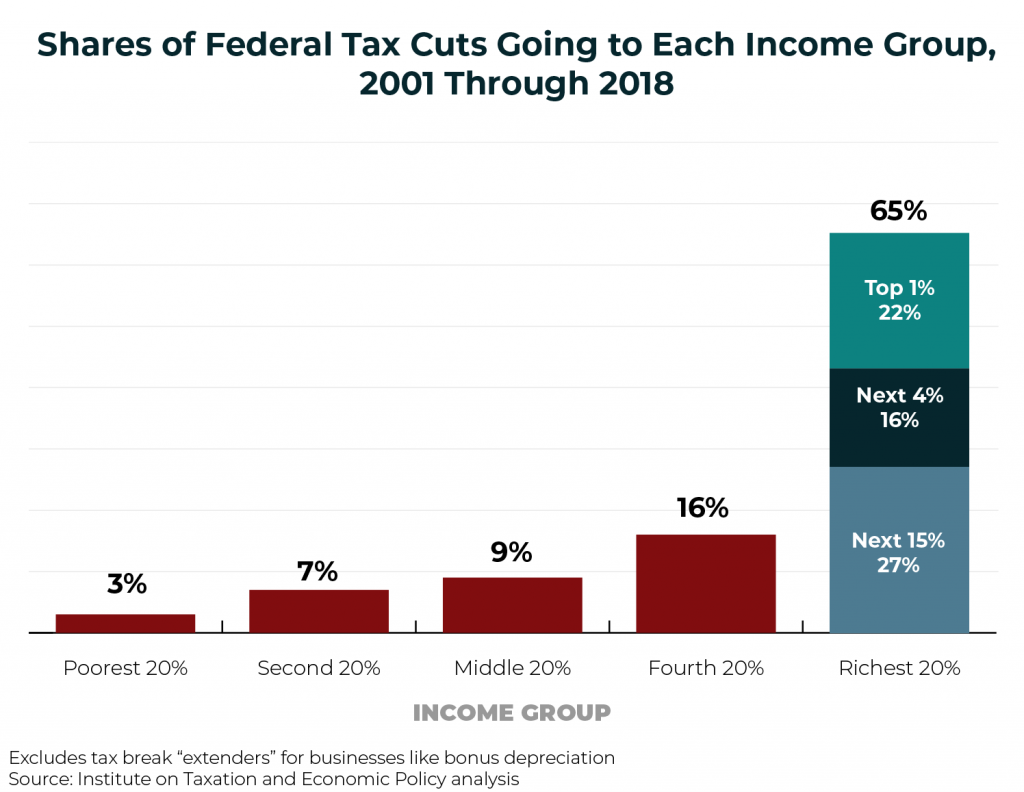
For years, Americans have been told that the rich are paying a highly disproportionate share of the nation’s taxes. Claims to that effect often focus on just one tax, the federal personal income tax, which is indeed progressive overall. But when the nation’s tax system is viewed in its entirety, it becomes clear that the reality is very different. Despite their enormous incomes and wealth, the nation’s richest taxpayers are paying a share of overall taxes that slightly exceeds their share of income.
State Rundown 4/11: An Estate Tax Win, Opioid Progress, and Teacher Uprising Updates
April 11, 2019 • By ITEP Staff
Hawaii made progress in pushing back against the increasing concentration of wealth and power by beefing up its estate tax. Delaware, New Jersey, and Rhode Island all took steps toward taxing opioid producers to raise funds to address the ongoing opioid crisis. Oregon lawmakers continue to try to address their chronic school underfunding with a $2 billion annual investment, in contrast to some of their counterparts in North Carolina who are responding to similar issues with the opposite approach, proposing to slash taxes in the face of their school funding issues – just as research highlighted in our What We’re…
Corporate Tax Avoidance Remains Rampant Under New Tax Law
April 11, 2019 • By Lorena Roque, Matthew Gardner, Steve Wamhoff
For decades, profitable Fortune 500 companies have been able to manipulate the tax system to avoid paying even a dime in tax on billions of dollars in U.S. profits. This ITEP report provides the first comprehensive look at how the new corporate tax laws that took effect after the passage of the 2017 Tax Cuts and Jobs Act affects the scale of corporate tax avoidance.
The Working Families Tax Relief Act Would Boost Incomes and Economic Security for Workers and Children
April 10, 2019 • By Steve Wamhoff
Sens. Sherrod Brown, Michael Bennet, Richard Durbin, and Ron Wyden (along with the backing of most of the Democratic caucus in the Senate) today rolled out a new proposal to expand the Child Tax Credit (CTC) and Earned Income Tax Credit (EITC). Called the Working Families Tax Relief Act (WFTRA), the proposal would provide a substantial benefit, especially to low-income working families.
State Rundown 4/4: Ohio Gas Tax and Maryland Minimum Wage Get Needed Updates
April 4, 2019 • By ITEP Staff
Transportation funding was a hot topic this week, as OHIO lawmakers responsibly voted to update their gas tax and offset some of its impact on lower-income families with an Earned Income Tax Credit (EITC) boost, while NEW YORK enacted the nation’s first “congestion pricing” charge, and LOUISIANA and VIRGINIA leaders looked at gas tax updates as well—a trend ITEP’s Carl Davis explored in depth today here. Broad tax packages are also being hashed out in LOUISIANA, NEBRASKA, OREGON, and TEXAS. And MARYLAND became the sixth state with a $15 minimum wage on the horizon.

A chorus is building and calling on our elected officials to tax the rich. And pundits and policymakers are seriously debating proposals calling for higher income taxes and a wealth tax instead of attempting to shut down the conversation by labeling such proposals as class warfare.

Institute on Taxation
and Economic Policy
ITEP is a non-profit, non-partisan tax policy organization. We conduct rigorous analyses of tax and economic proposals and provide data-driven recommendations to shape equitable and sustainable tax systems.
Subscribe to ITEP Emails
Tax research and policy news in your inbox.
Promote Fair Tax Policy
Your gift to ITEP promotes tax justice. With your help, we do research that supports taxing millionaires and billionaires, taxing big corporations and raising revenue for the things our people, our communities and our planet need.
Together, we can create a country with more economic justice, more racial justice, more climate justice… and more tax justice.