Updated July 22, 2025
On July 4, President Trump signed into law the tax and spending “megabill” which makes permanent the provisions of the 2017 tax law that were set to expire and makes many additional changes beyond that. This analysis examines the tax provisions in the law and provides numbers generated with the ITEP microsimulation model.
Overall, the law favors the richest taxpayers and provides working-class Americans with relatively small tax cuts that will in many cases be more than offset by the import taxes, or tariffs, imposed by President Trump.
The new law will have the following effects on taxpayers:
- More than 70 percent of the net tax cuts will go to the richest fifth of Americans in 2026, only 10 percent will go to the middle fifth of Americans, and less than 1 percent will go to the poorest fifth.
- The richest 5 percent alone will receive 45 percent of the net tax cuts next year.
- The richest 1 percent of Americans will receive an average net tax cut of $66,000, many, many times more than the average tax cut received by other income groups.
- The richest 1 percent of Americans will receive a total of $117 billion in net tax cuts in 2026. The middle 20 percent of taxpayers on the income scale, a group that has 20 times the number of taxpayers as the richest 1 percent, will receive less than half that much, $53 billion in net tax cuts that year.
- The $117 billion in net tax cuts going to the richest 1 percent next year will exceed the amount going to the entire bottom 60 percent of taxpayers (about $77 billion).
- The effects of President Trump’s tariff policies alone offset most of the tax cuts for the bottom 80 percent of Americans. For the bottom 40 percent of Americans, the tariffs impose a cost that is greater than the tax cuts they will receive under this legislation.
- Even foreign investors who own shares in U.S. companies will benefit more than many Americans. These foreign investors will enjoy $32 billion in tax cuts in 2026 compared to just $1.5 billion for the bottom 20 percent of Americans.
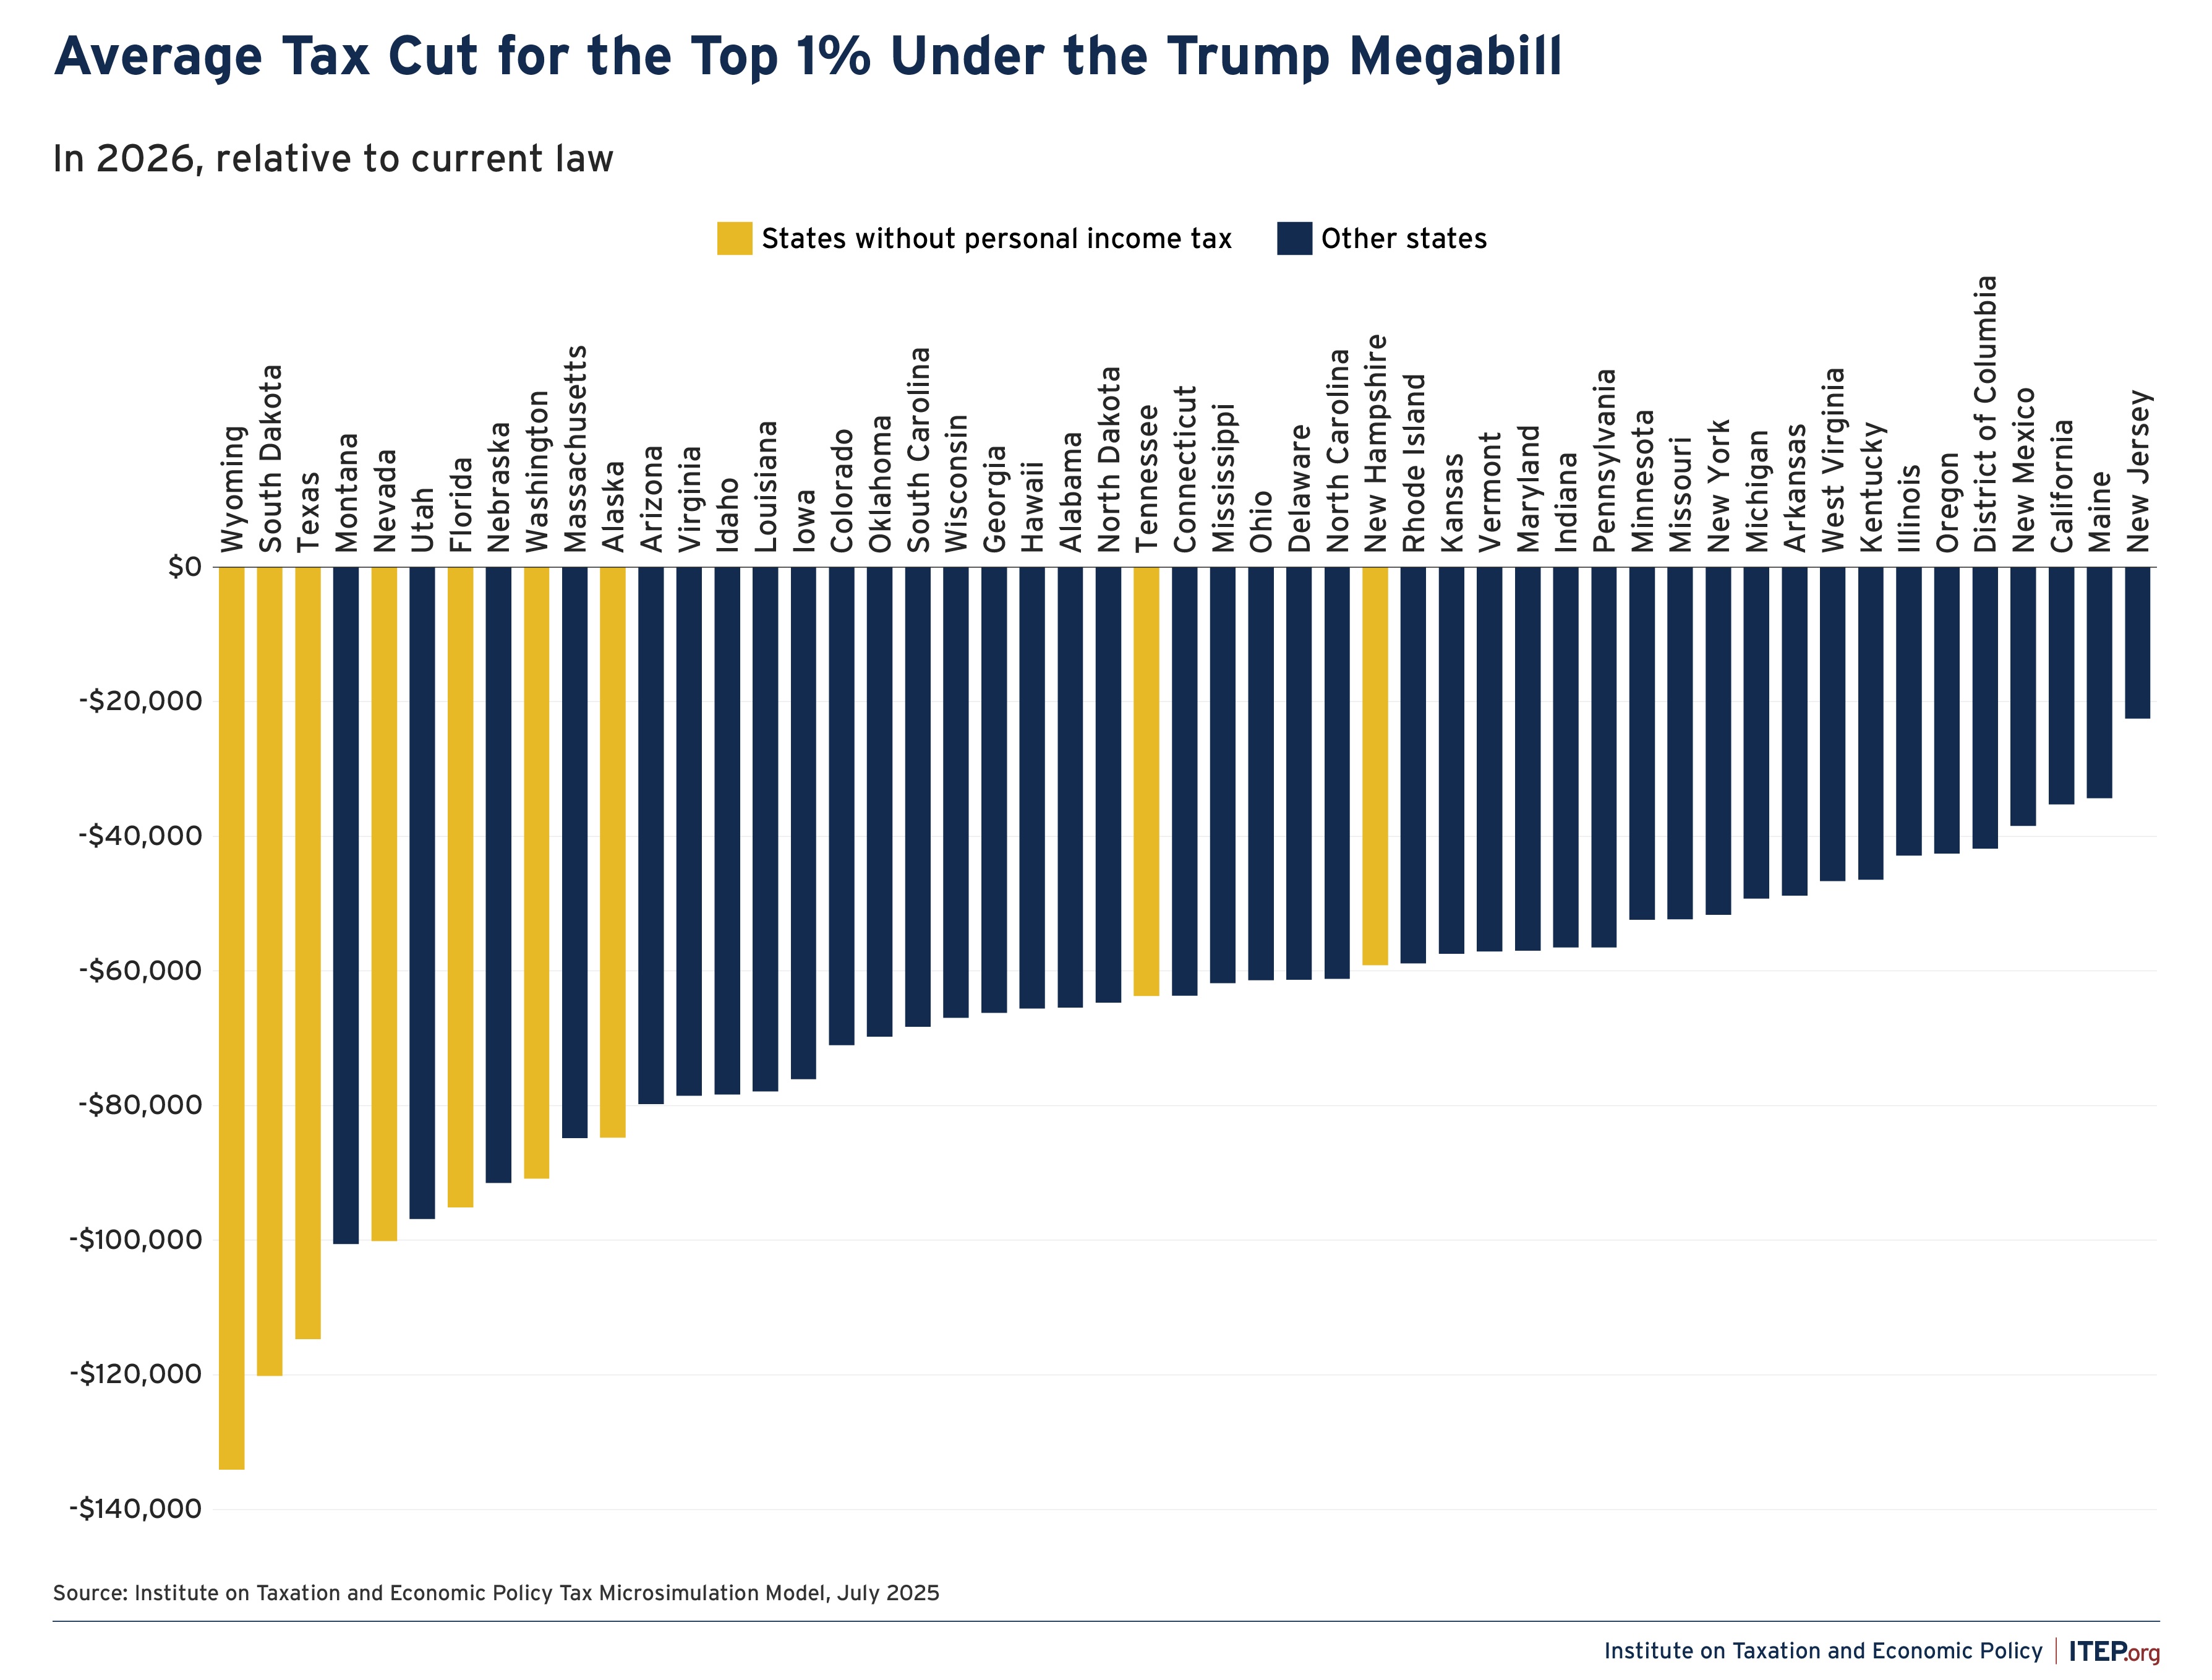
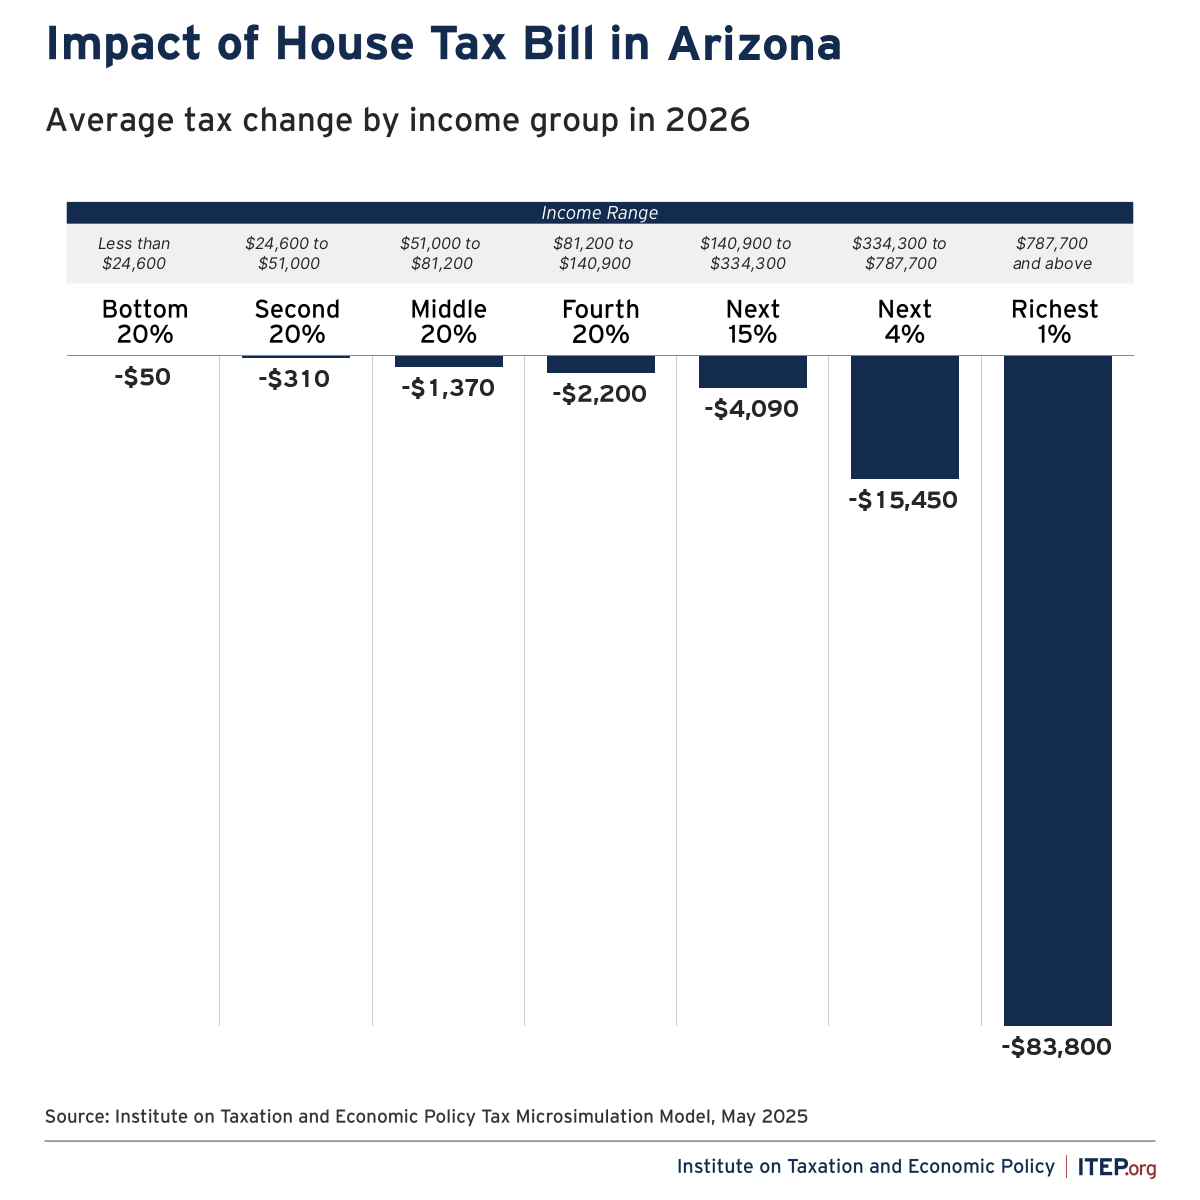
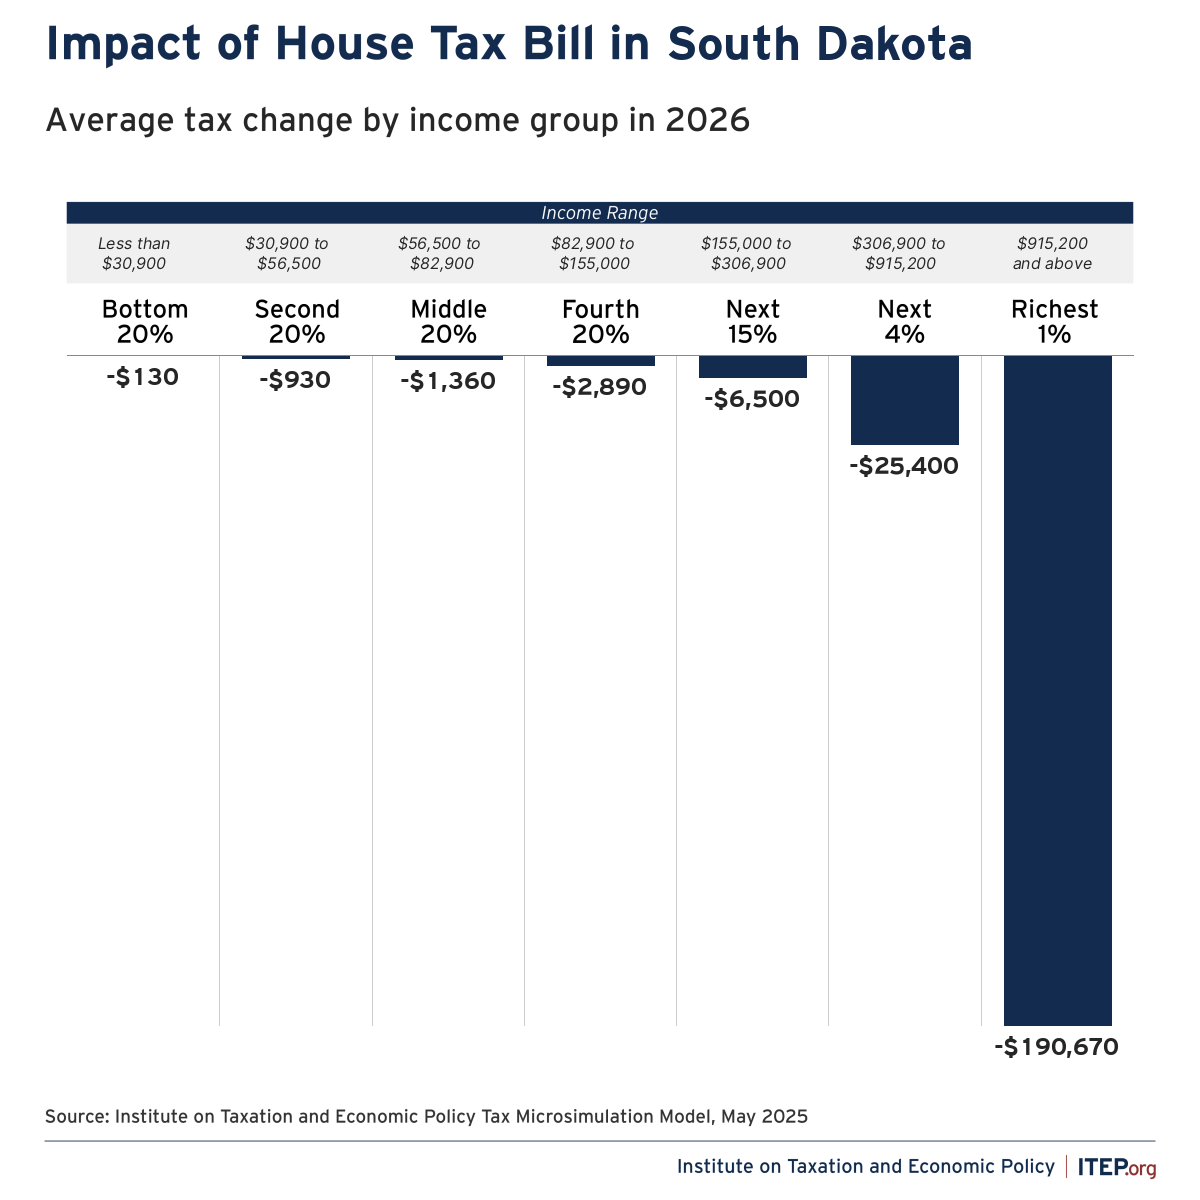
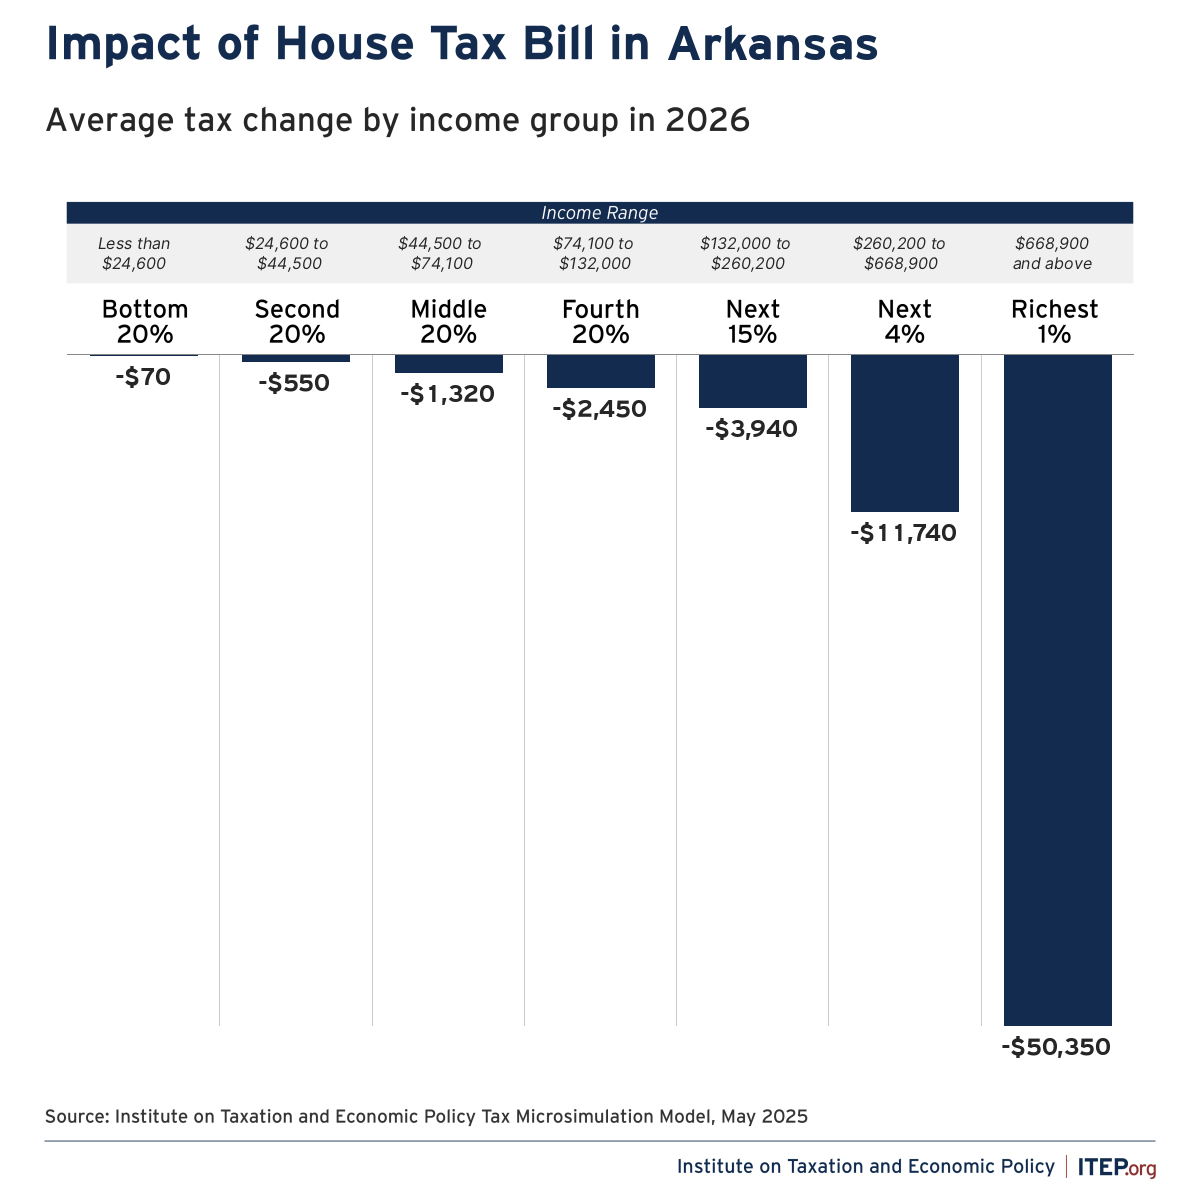
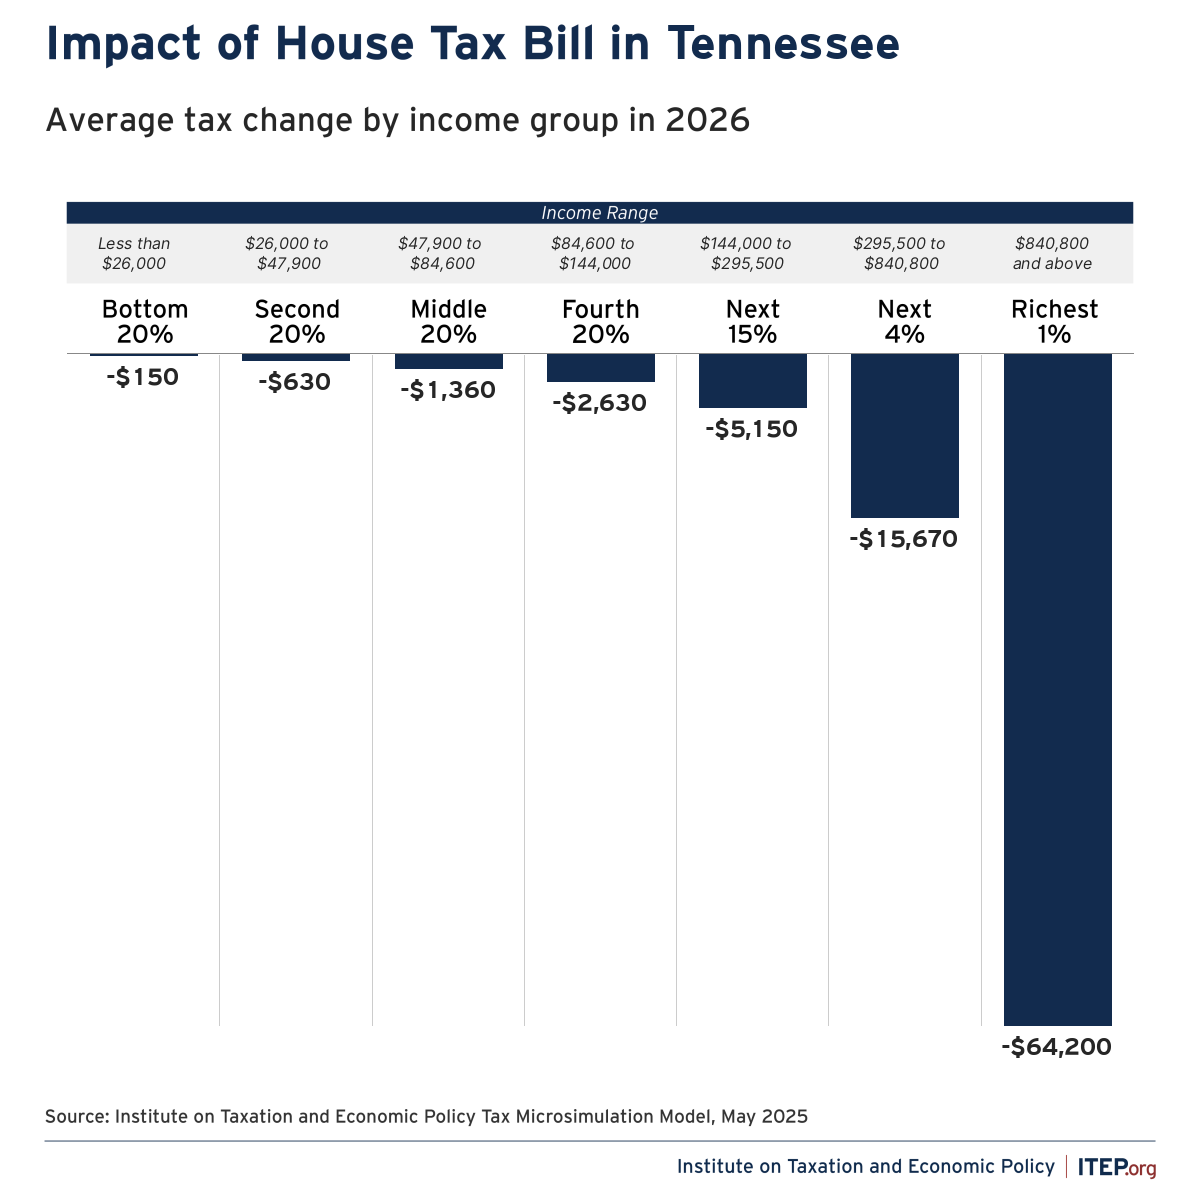
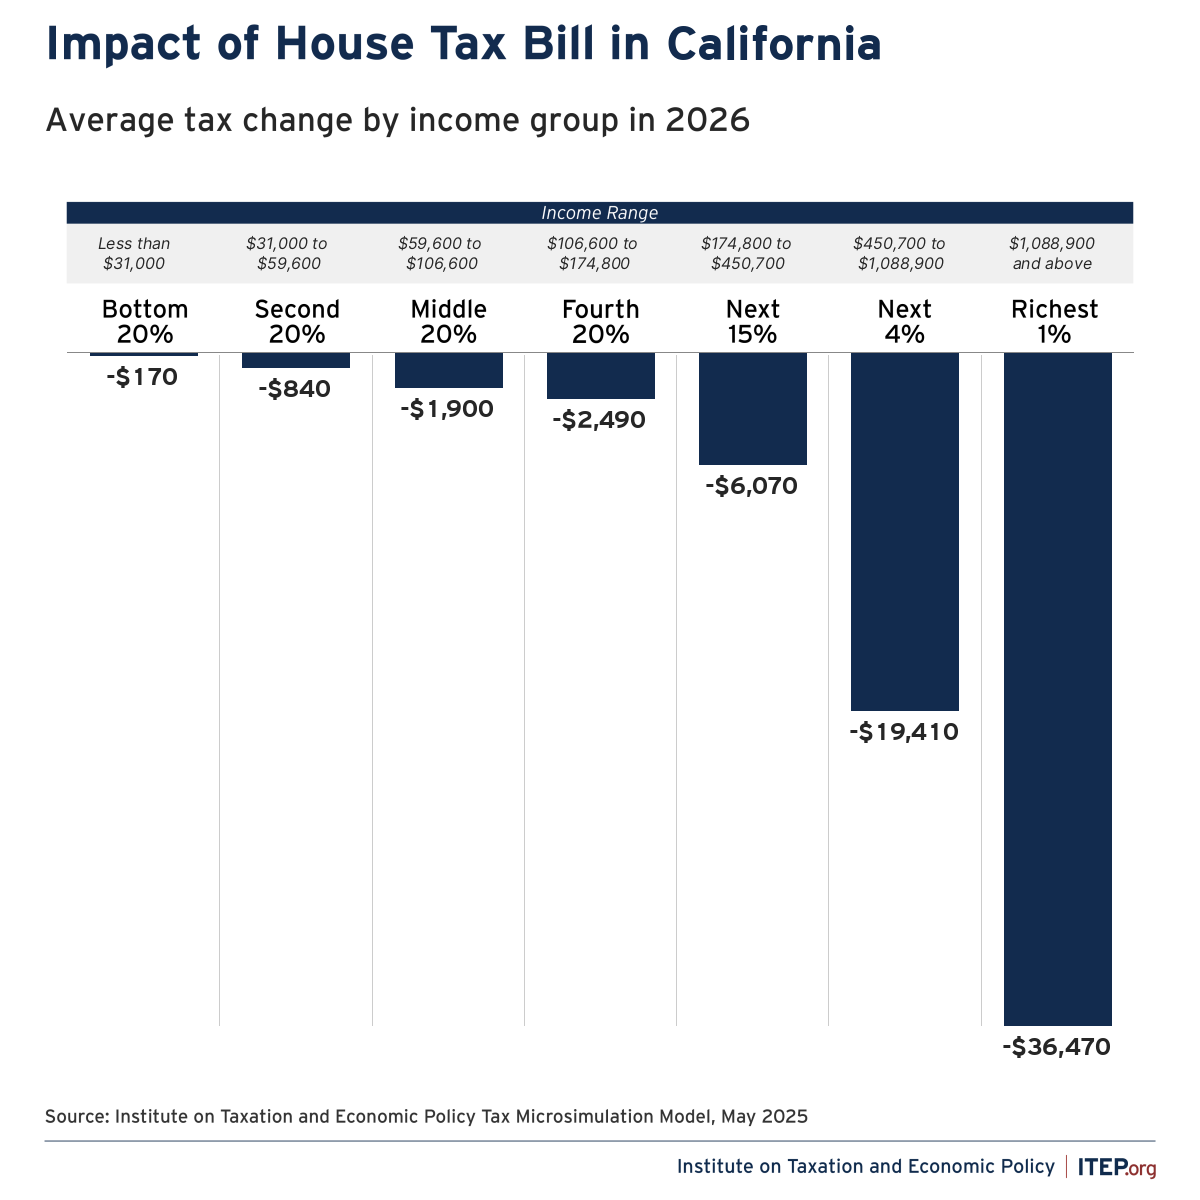
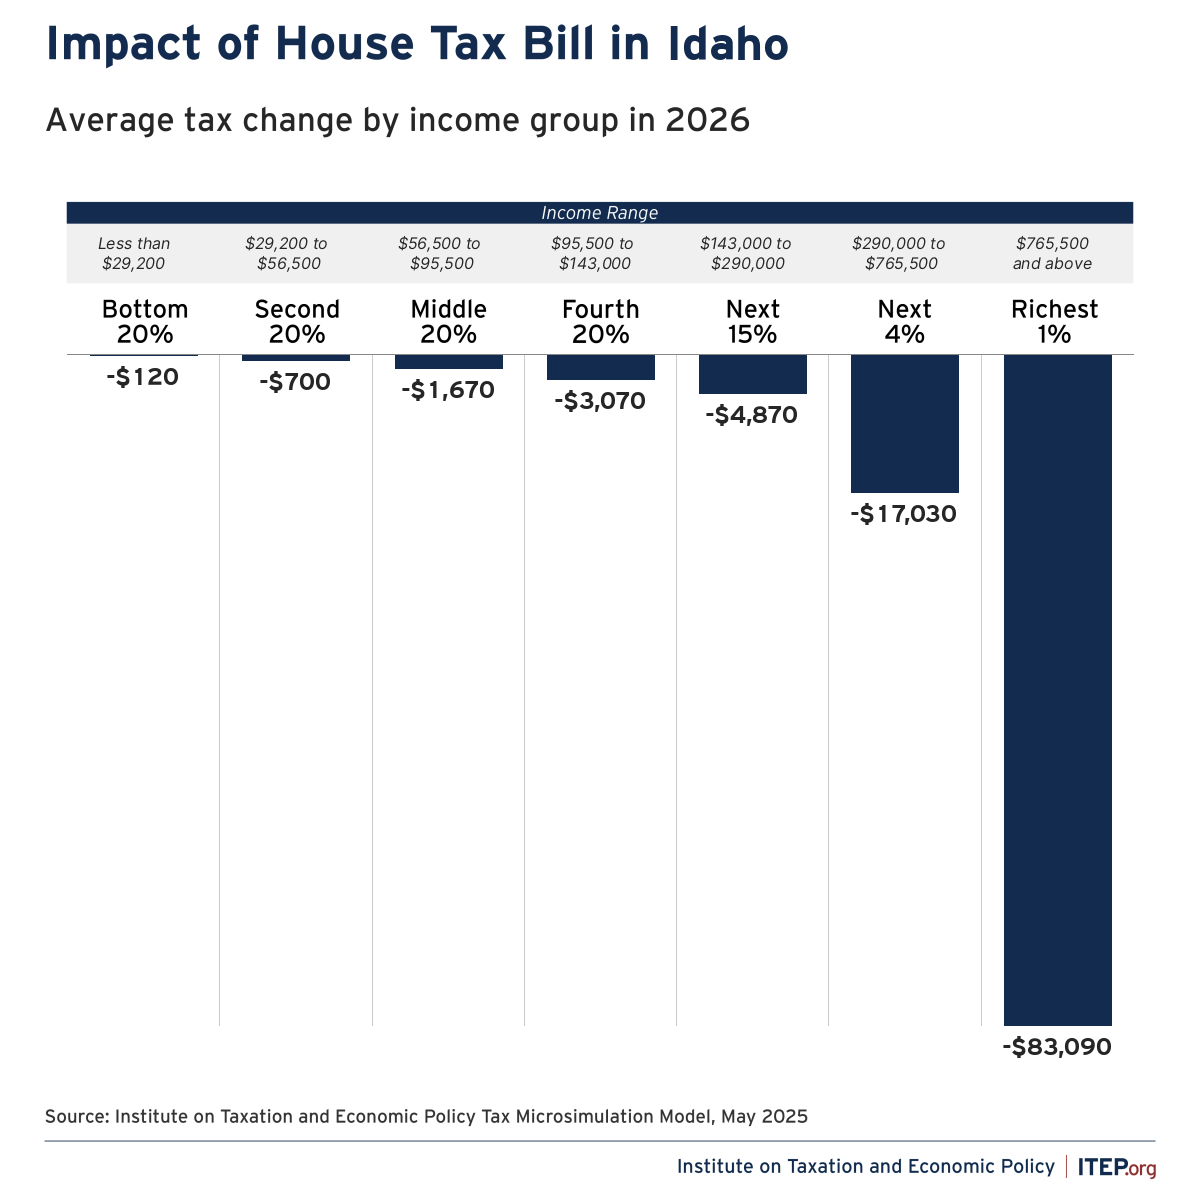
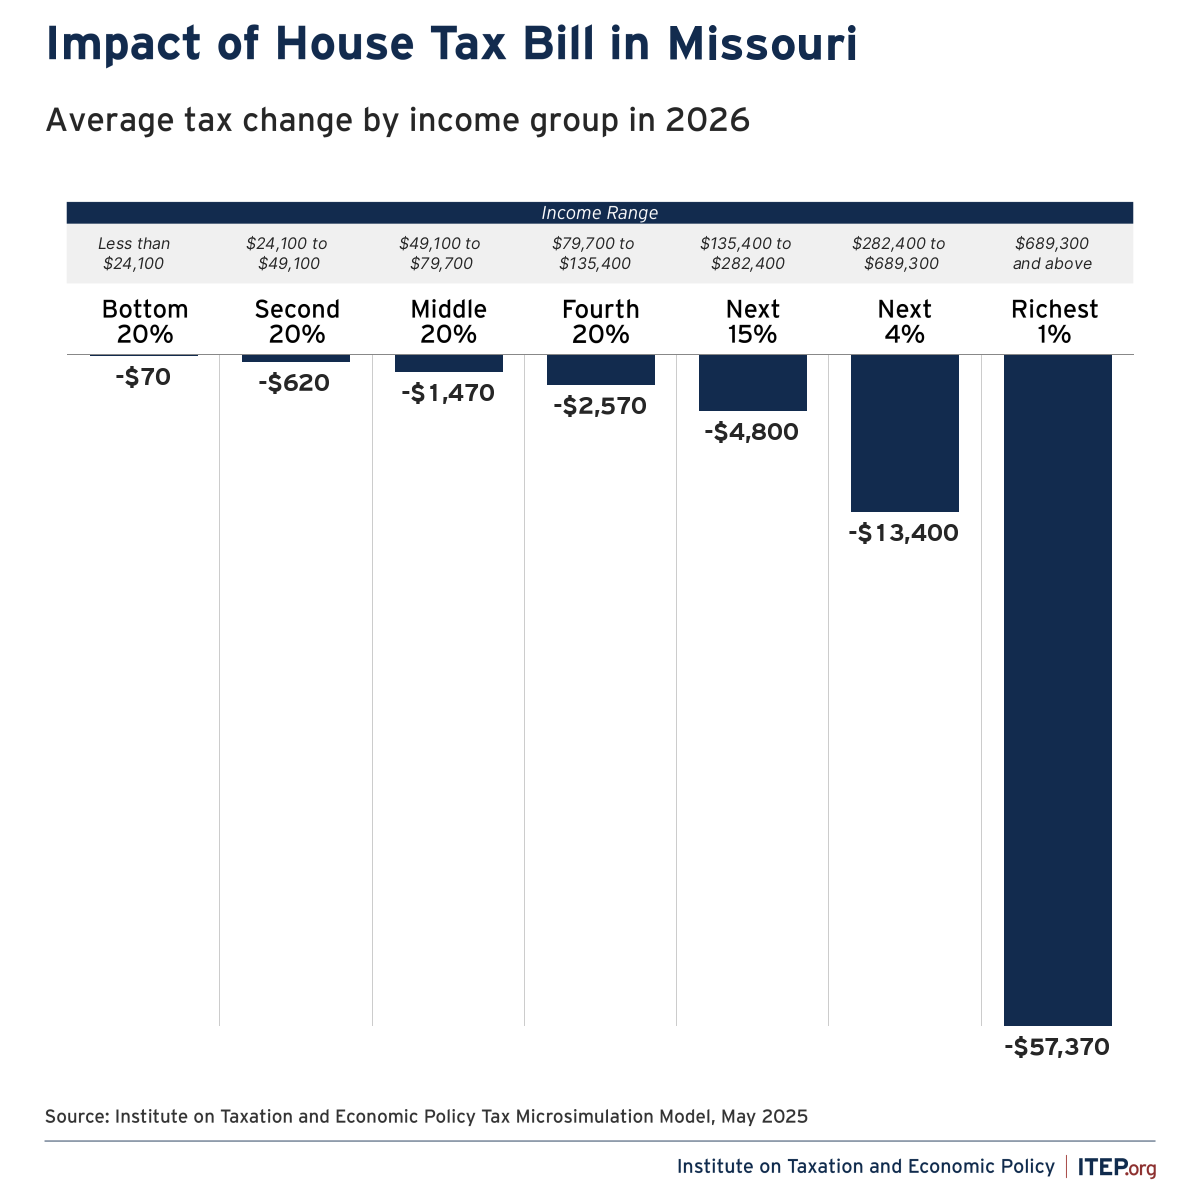
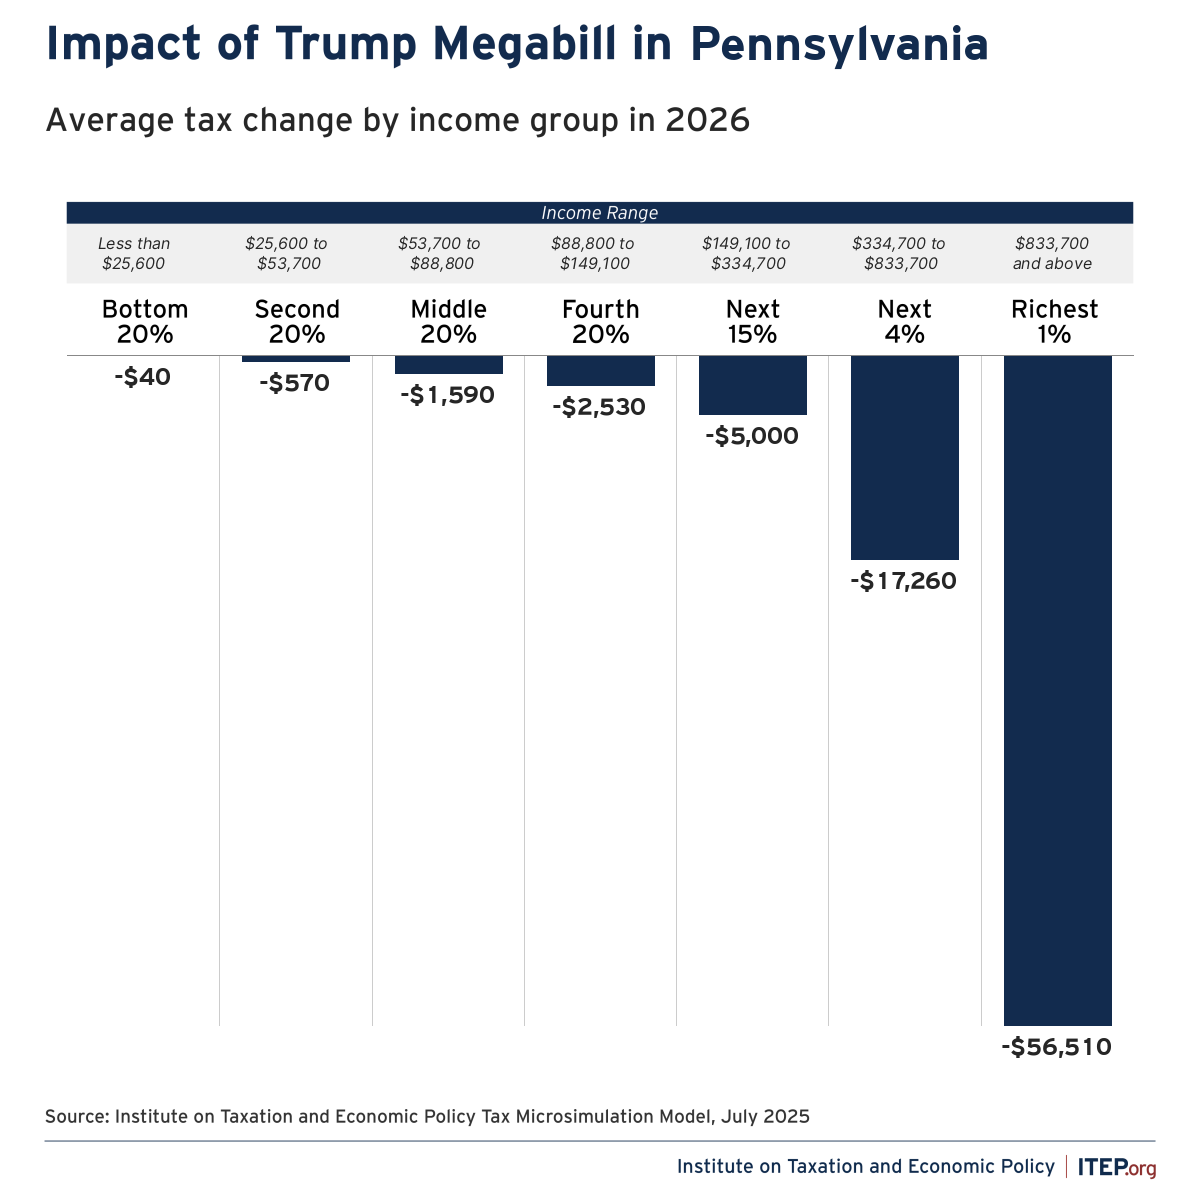
- The law provides the greatest rewards to high-income people living in states that have low state and local taxes on the wealthy. In these states, high-income people are not much affected by the cap on deductions for state and local taxes, which the law extends. As illustrated in Figure 6, the states where the richest 1 percent of residents receive the largest average net tax cuts will mostly be states that have particularly unfair tax systems because they have no personal income tax.
- Compared to what would have happened if Congress simply extended the tax breaks that were scheduled to expire at the end of the year (in other words, compared to what was current policy), the megabill hikes taxes for the bottom 40 percent of Americans overall.
- The megabill increases taxes on many Americans compared to what was current policy because the drafters of the megabill chose not to extend an enhancement of tax credits that help people secure health insurance, which expires at the end of 2025.
These figures do not include other potential costs to families in the megabill, such as deep cuts to Medicaid and food assistance. These cuts will have adverse health and financial implications for families that directly benefit from these programs. The cuts will also harm others in communities that are broadly dependent on these funding streams—such as rural communities, which will see hospital closings.
FIGURE 1
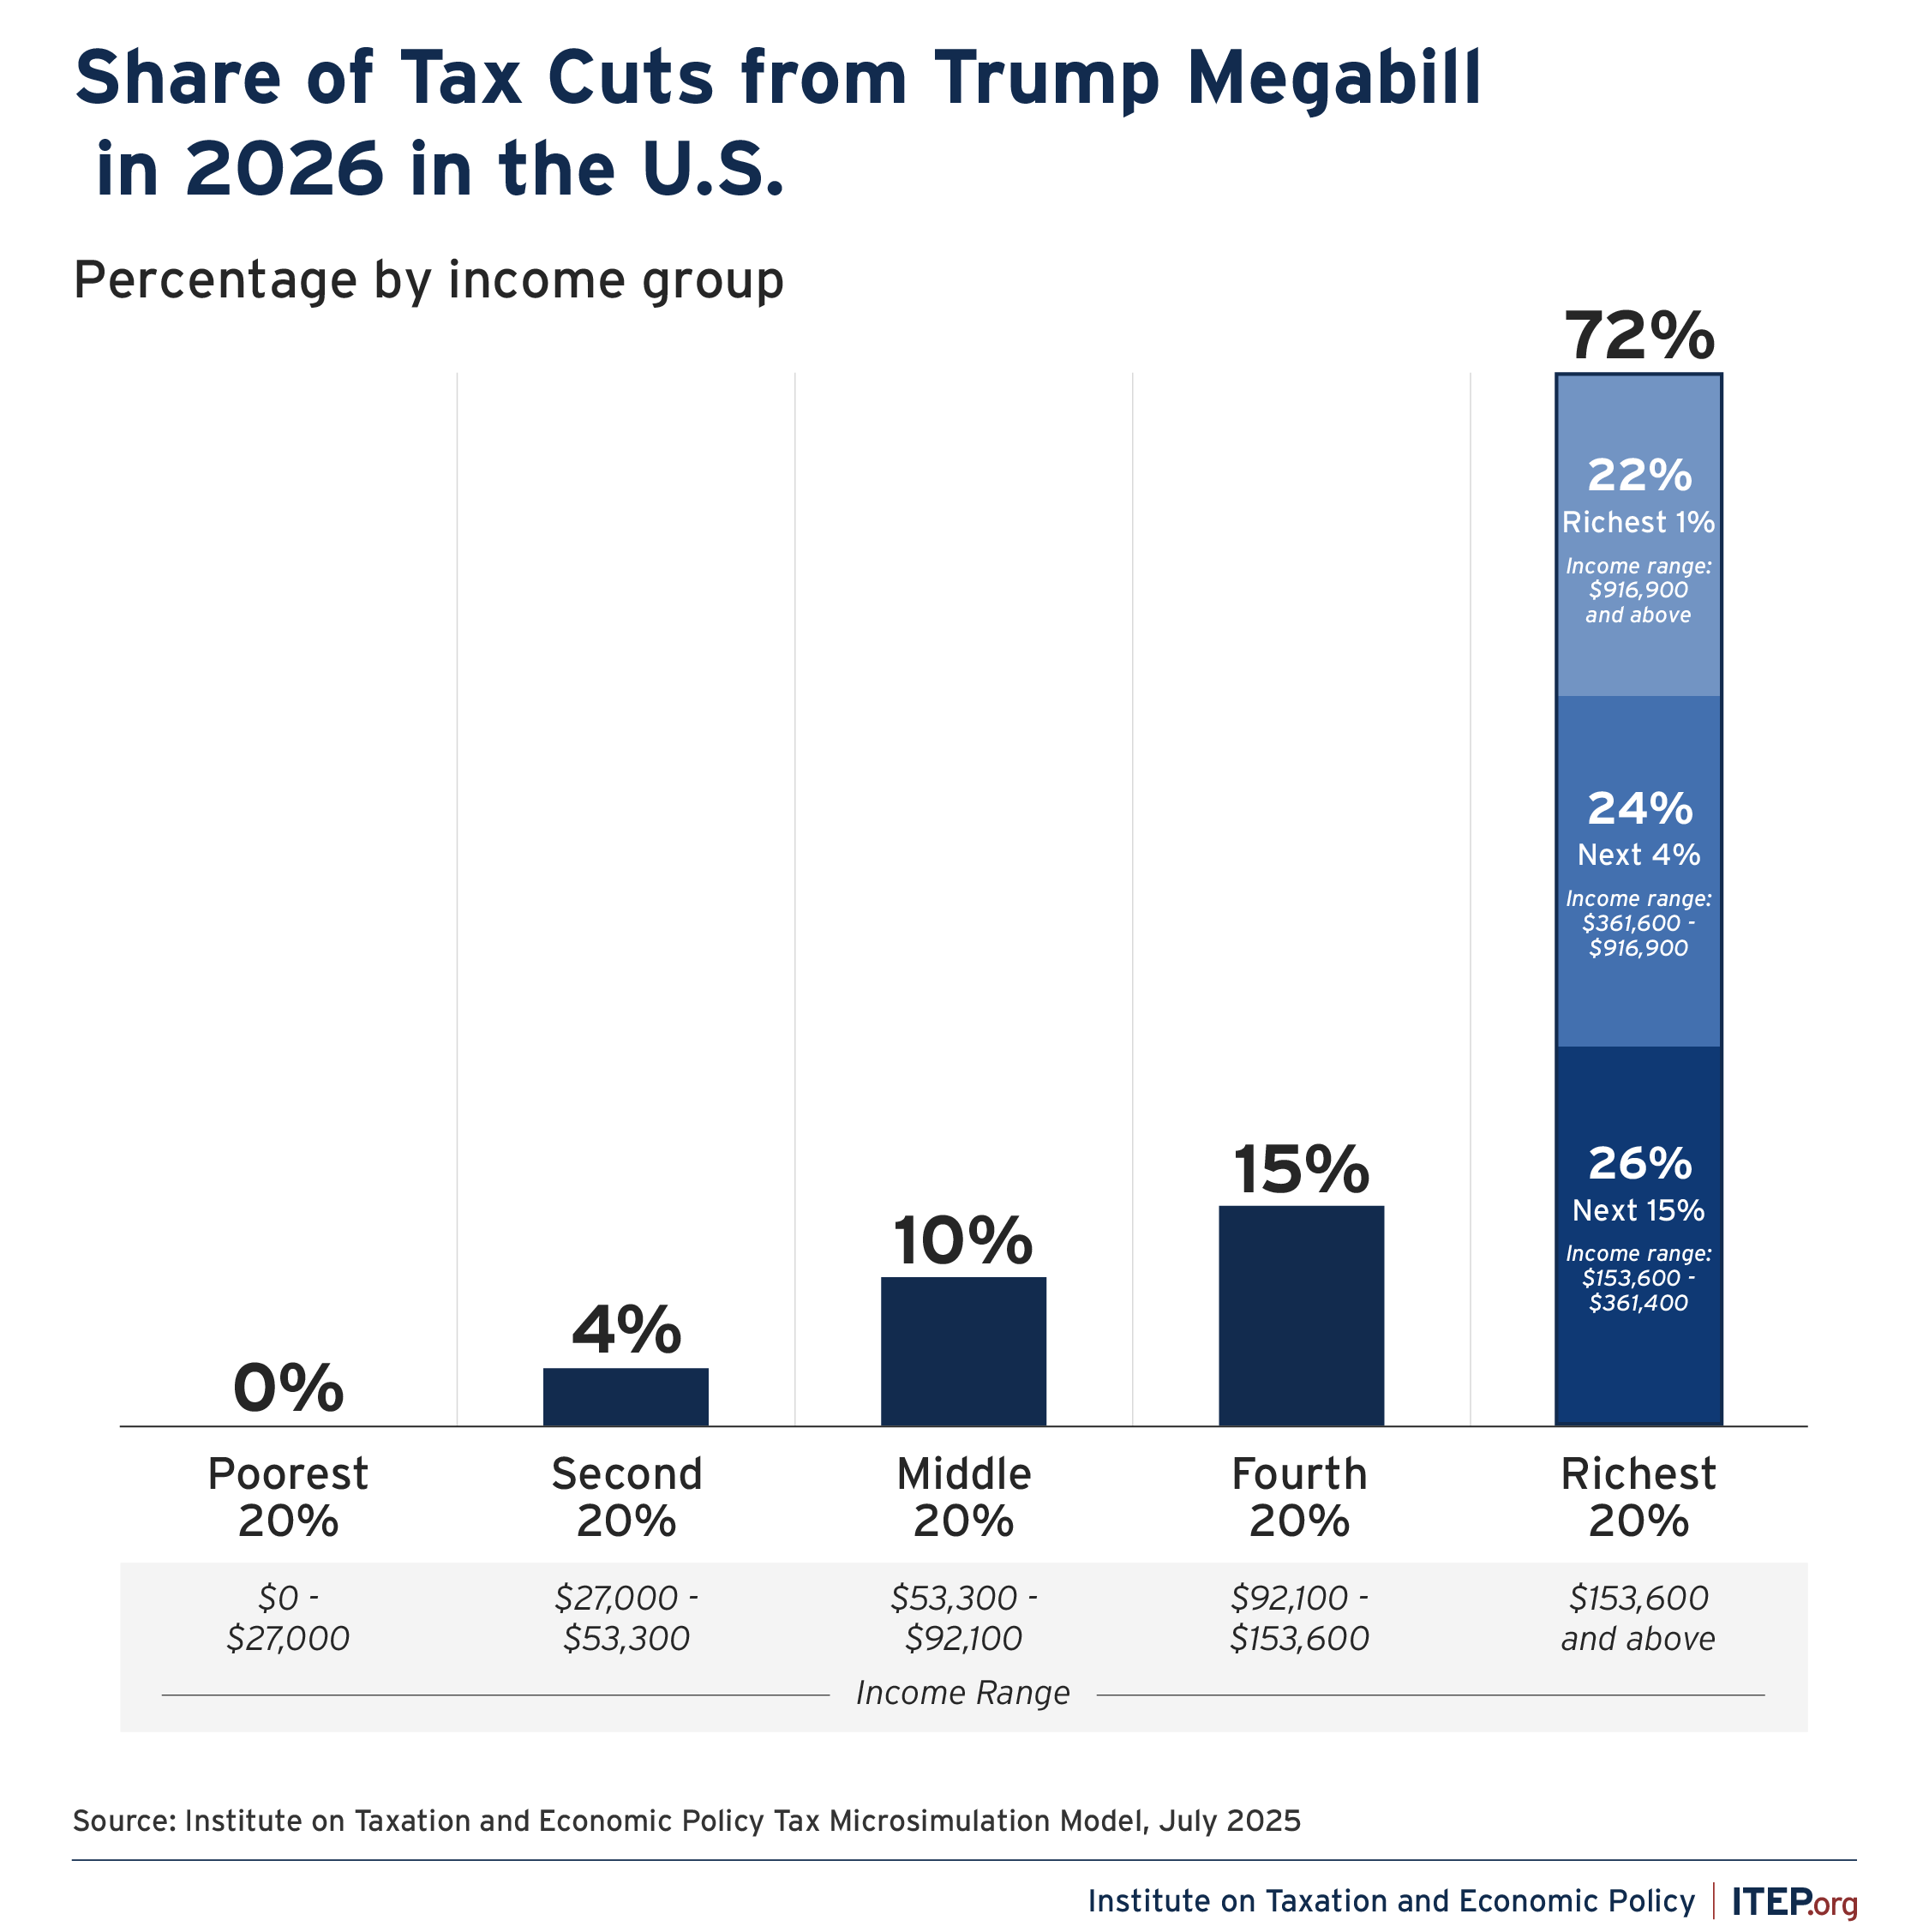
FIGURE 2
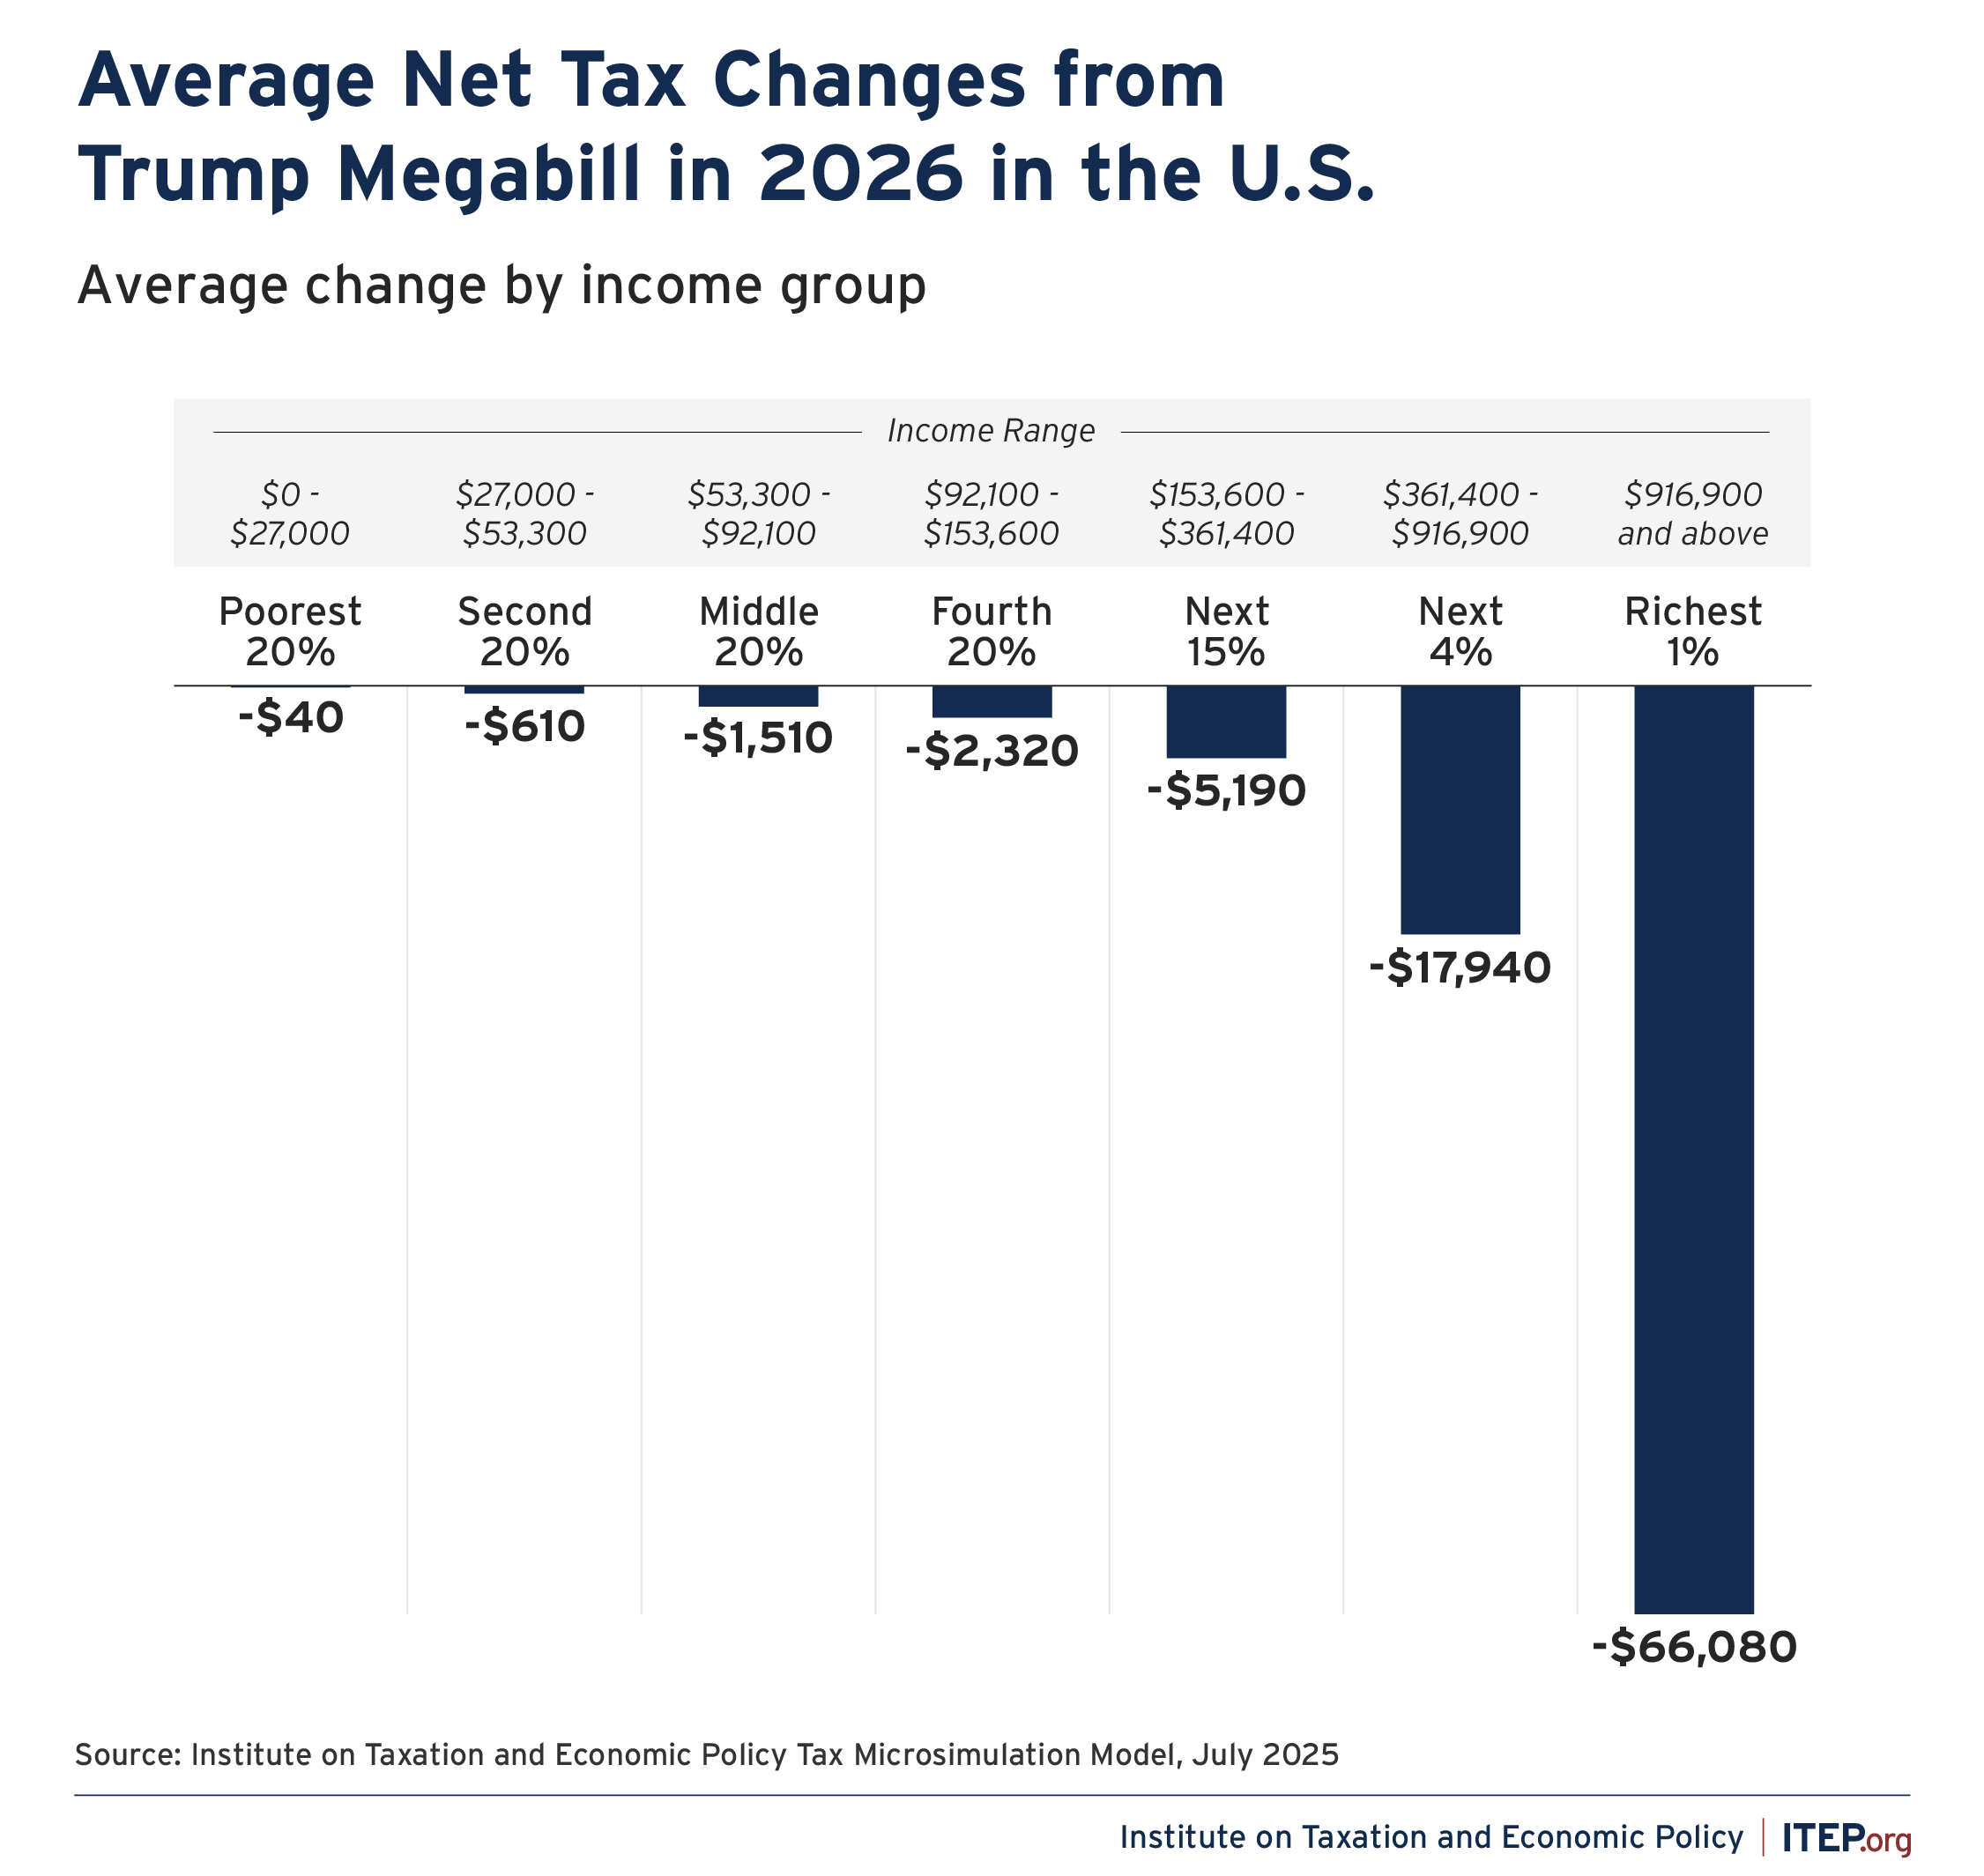
FIGURE 3
FIGURE 4
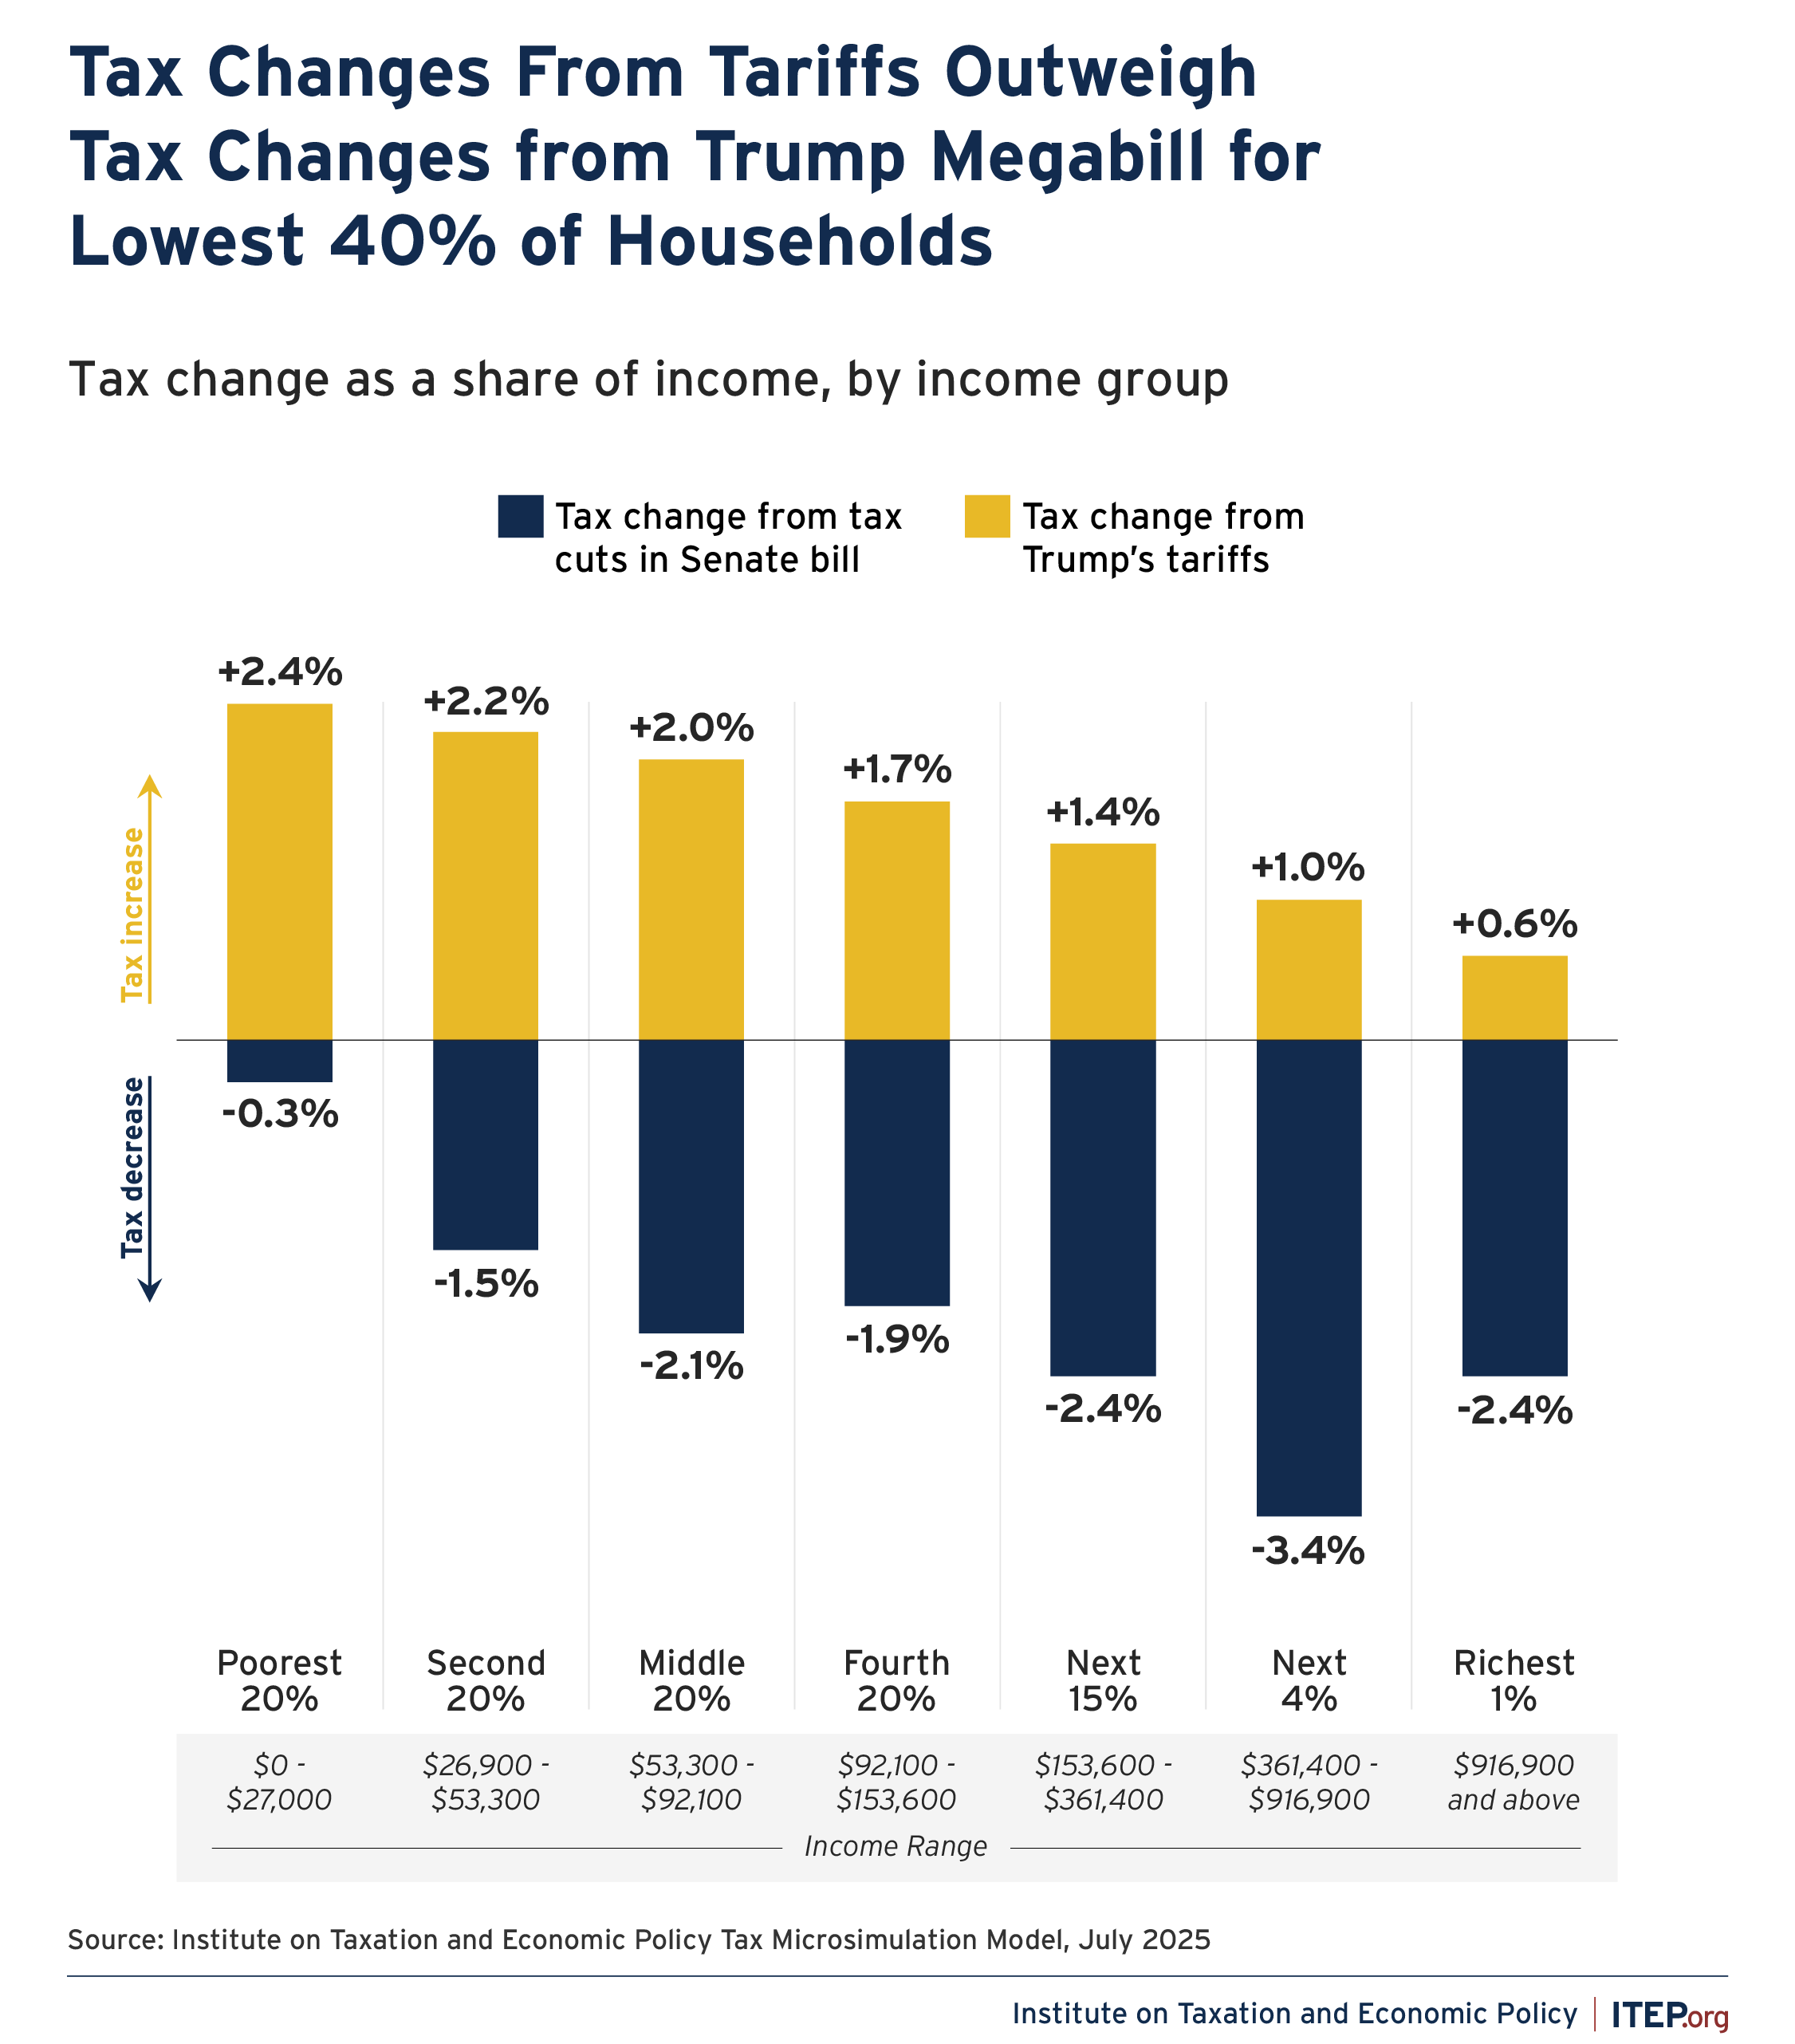
FIGURE 5
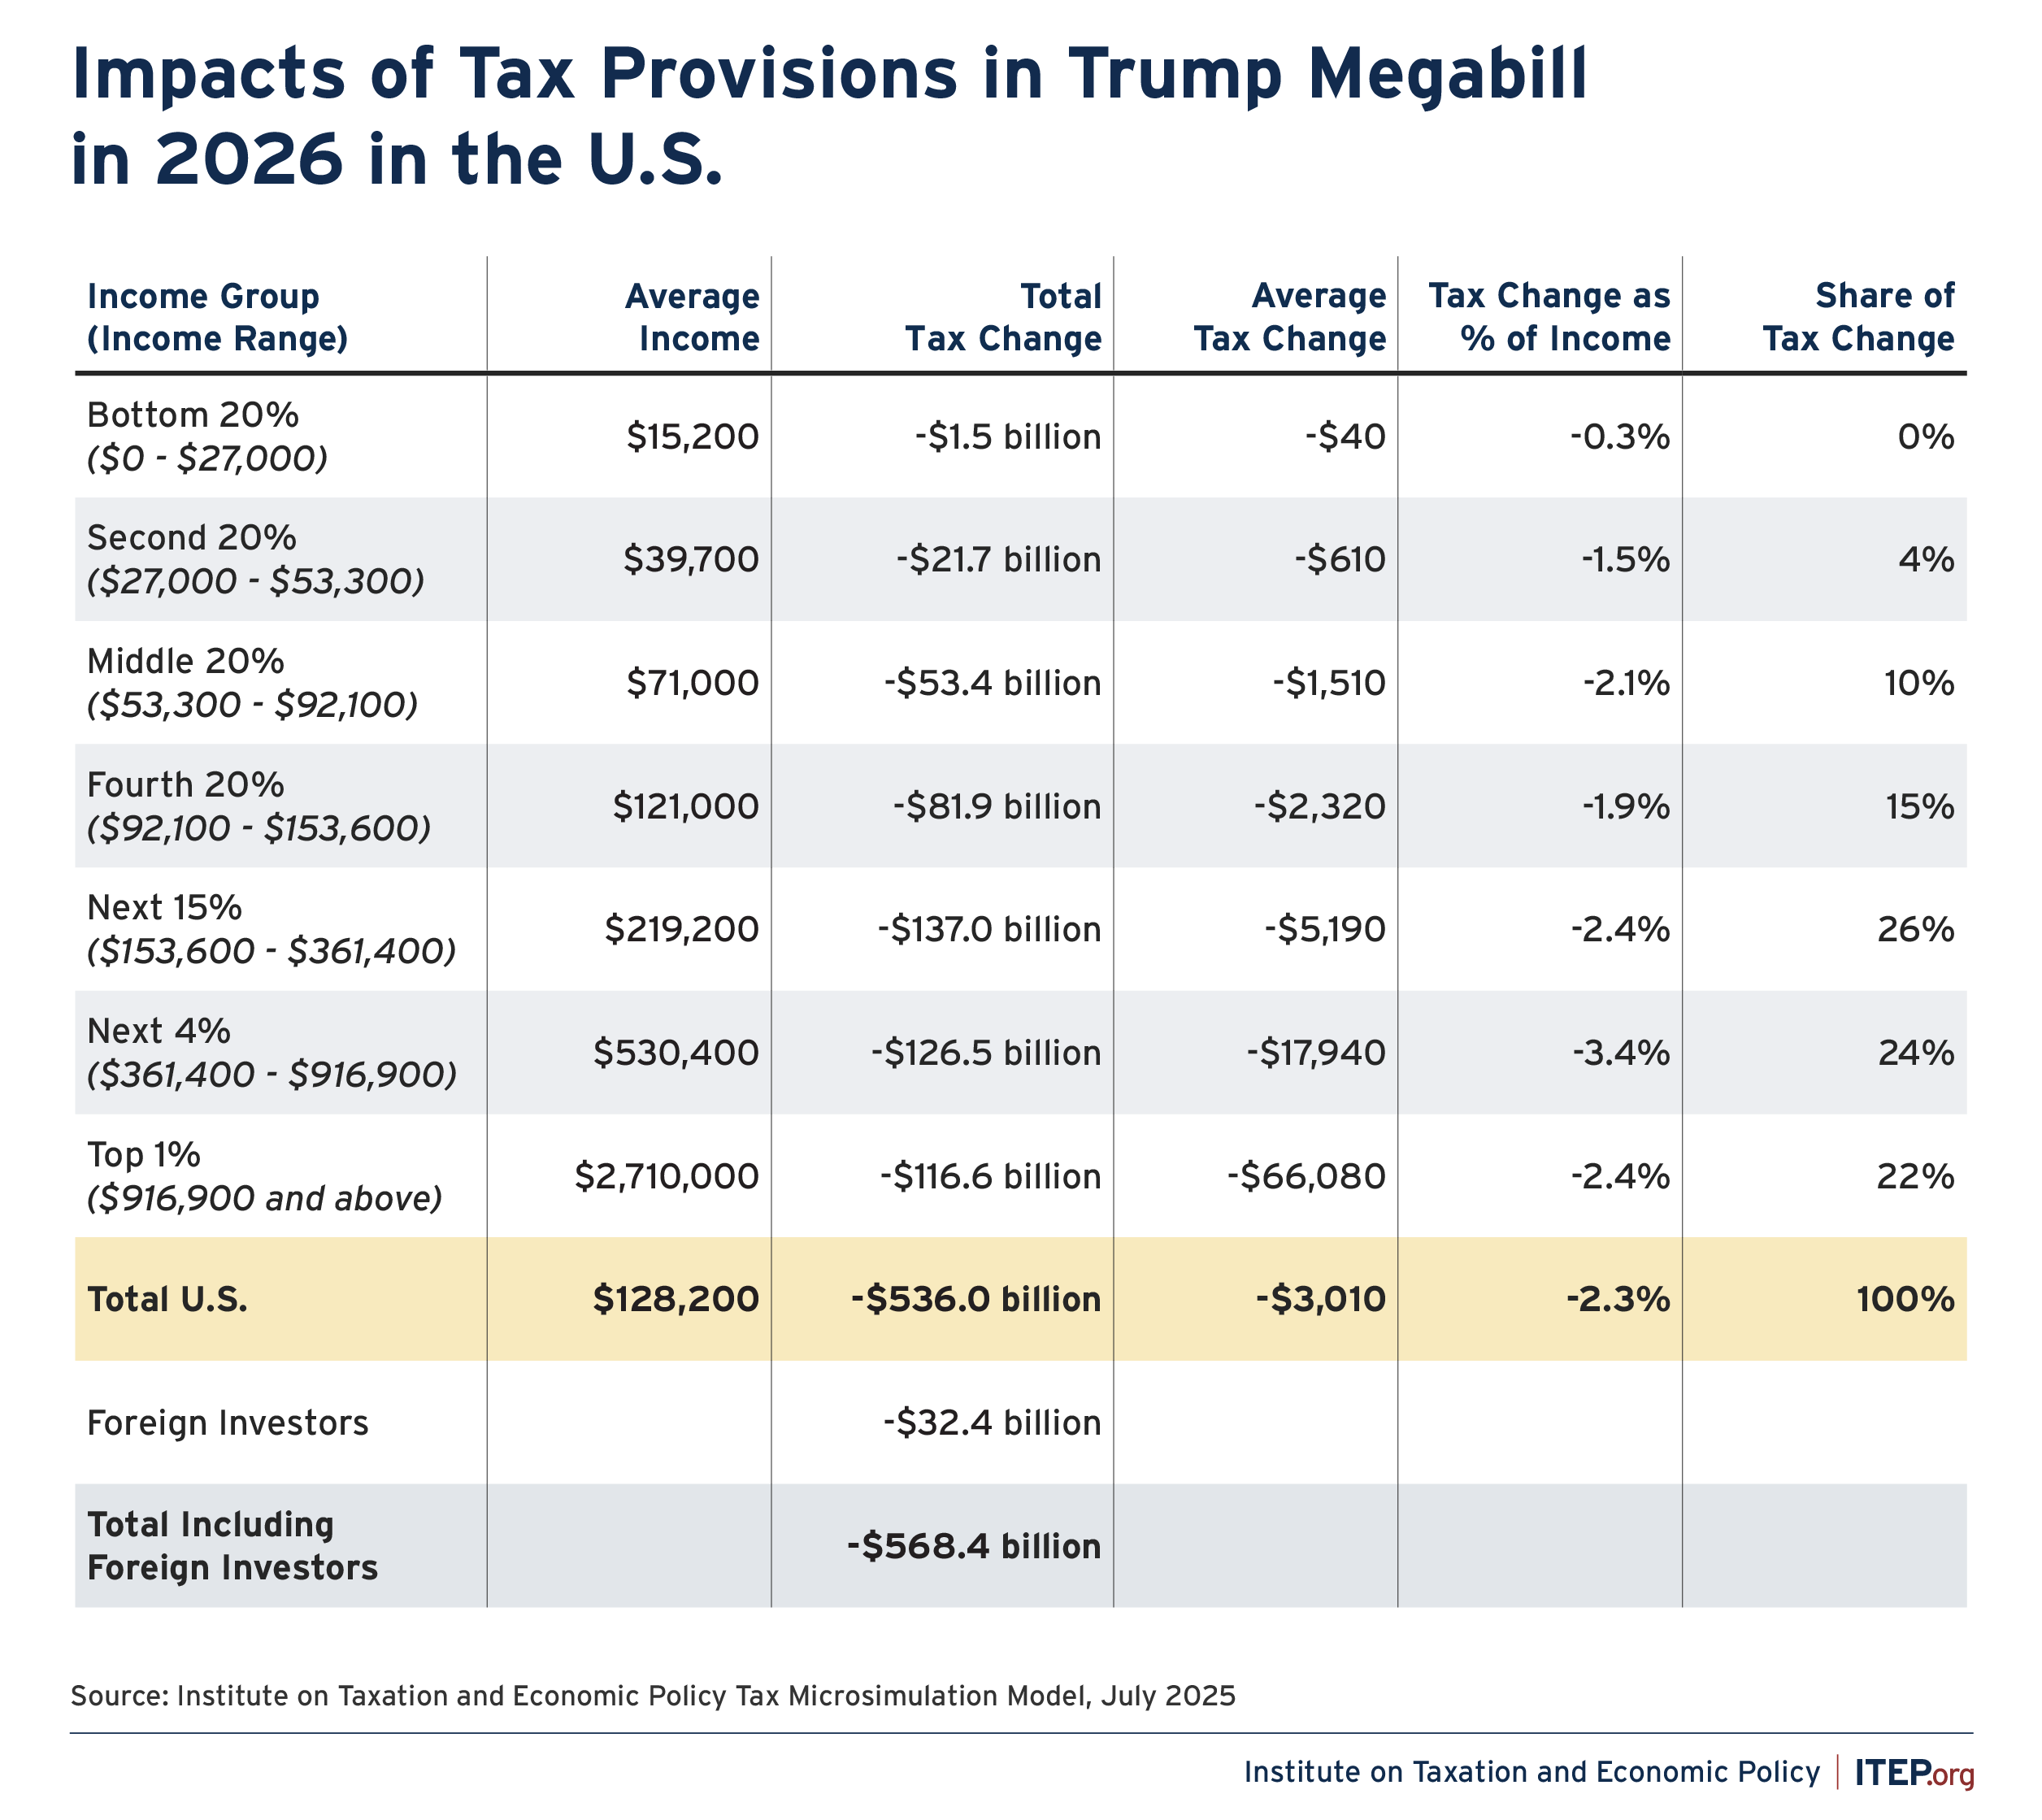
FIGURE 6
The megabill has three categories of tax provisions providing the biggest tax cuts to the richest 1 percent:
- Changes in tax rates and brackets will cut taxes for the richest 1 percent by an average $30,000 in 2026.
- The extension of the pass-through deduction (section 199A) for business owners will reduce taxes for the top 1 percent by an average $27,000 next year.
- A collection of business tax changes affecting corporations and other businesses will cut taxes by an average $38,000 next year for the top 1 percent.
- The Alternative Minimum Tax (AMT) and estate tax provisions provide more for the rich on top of that.
Provisions changing itemized deductions (most importantly the cap on itemized deductions for state and local taxes, or SALT) claw back an average of $38,000 of the tax cuts for the richest 1 percent. The SALT cap serves as a very partial limit on tax cuts for the richest Americans.
FIGURE 7
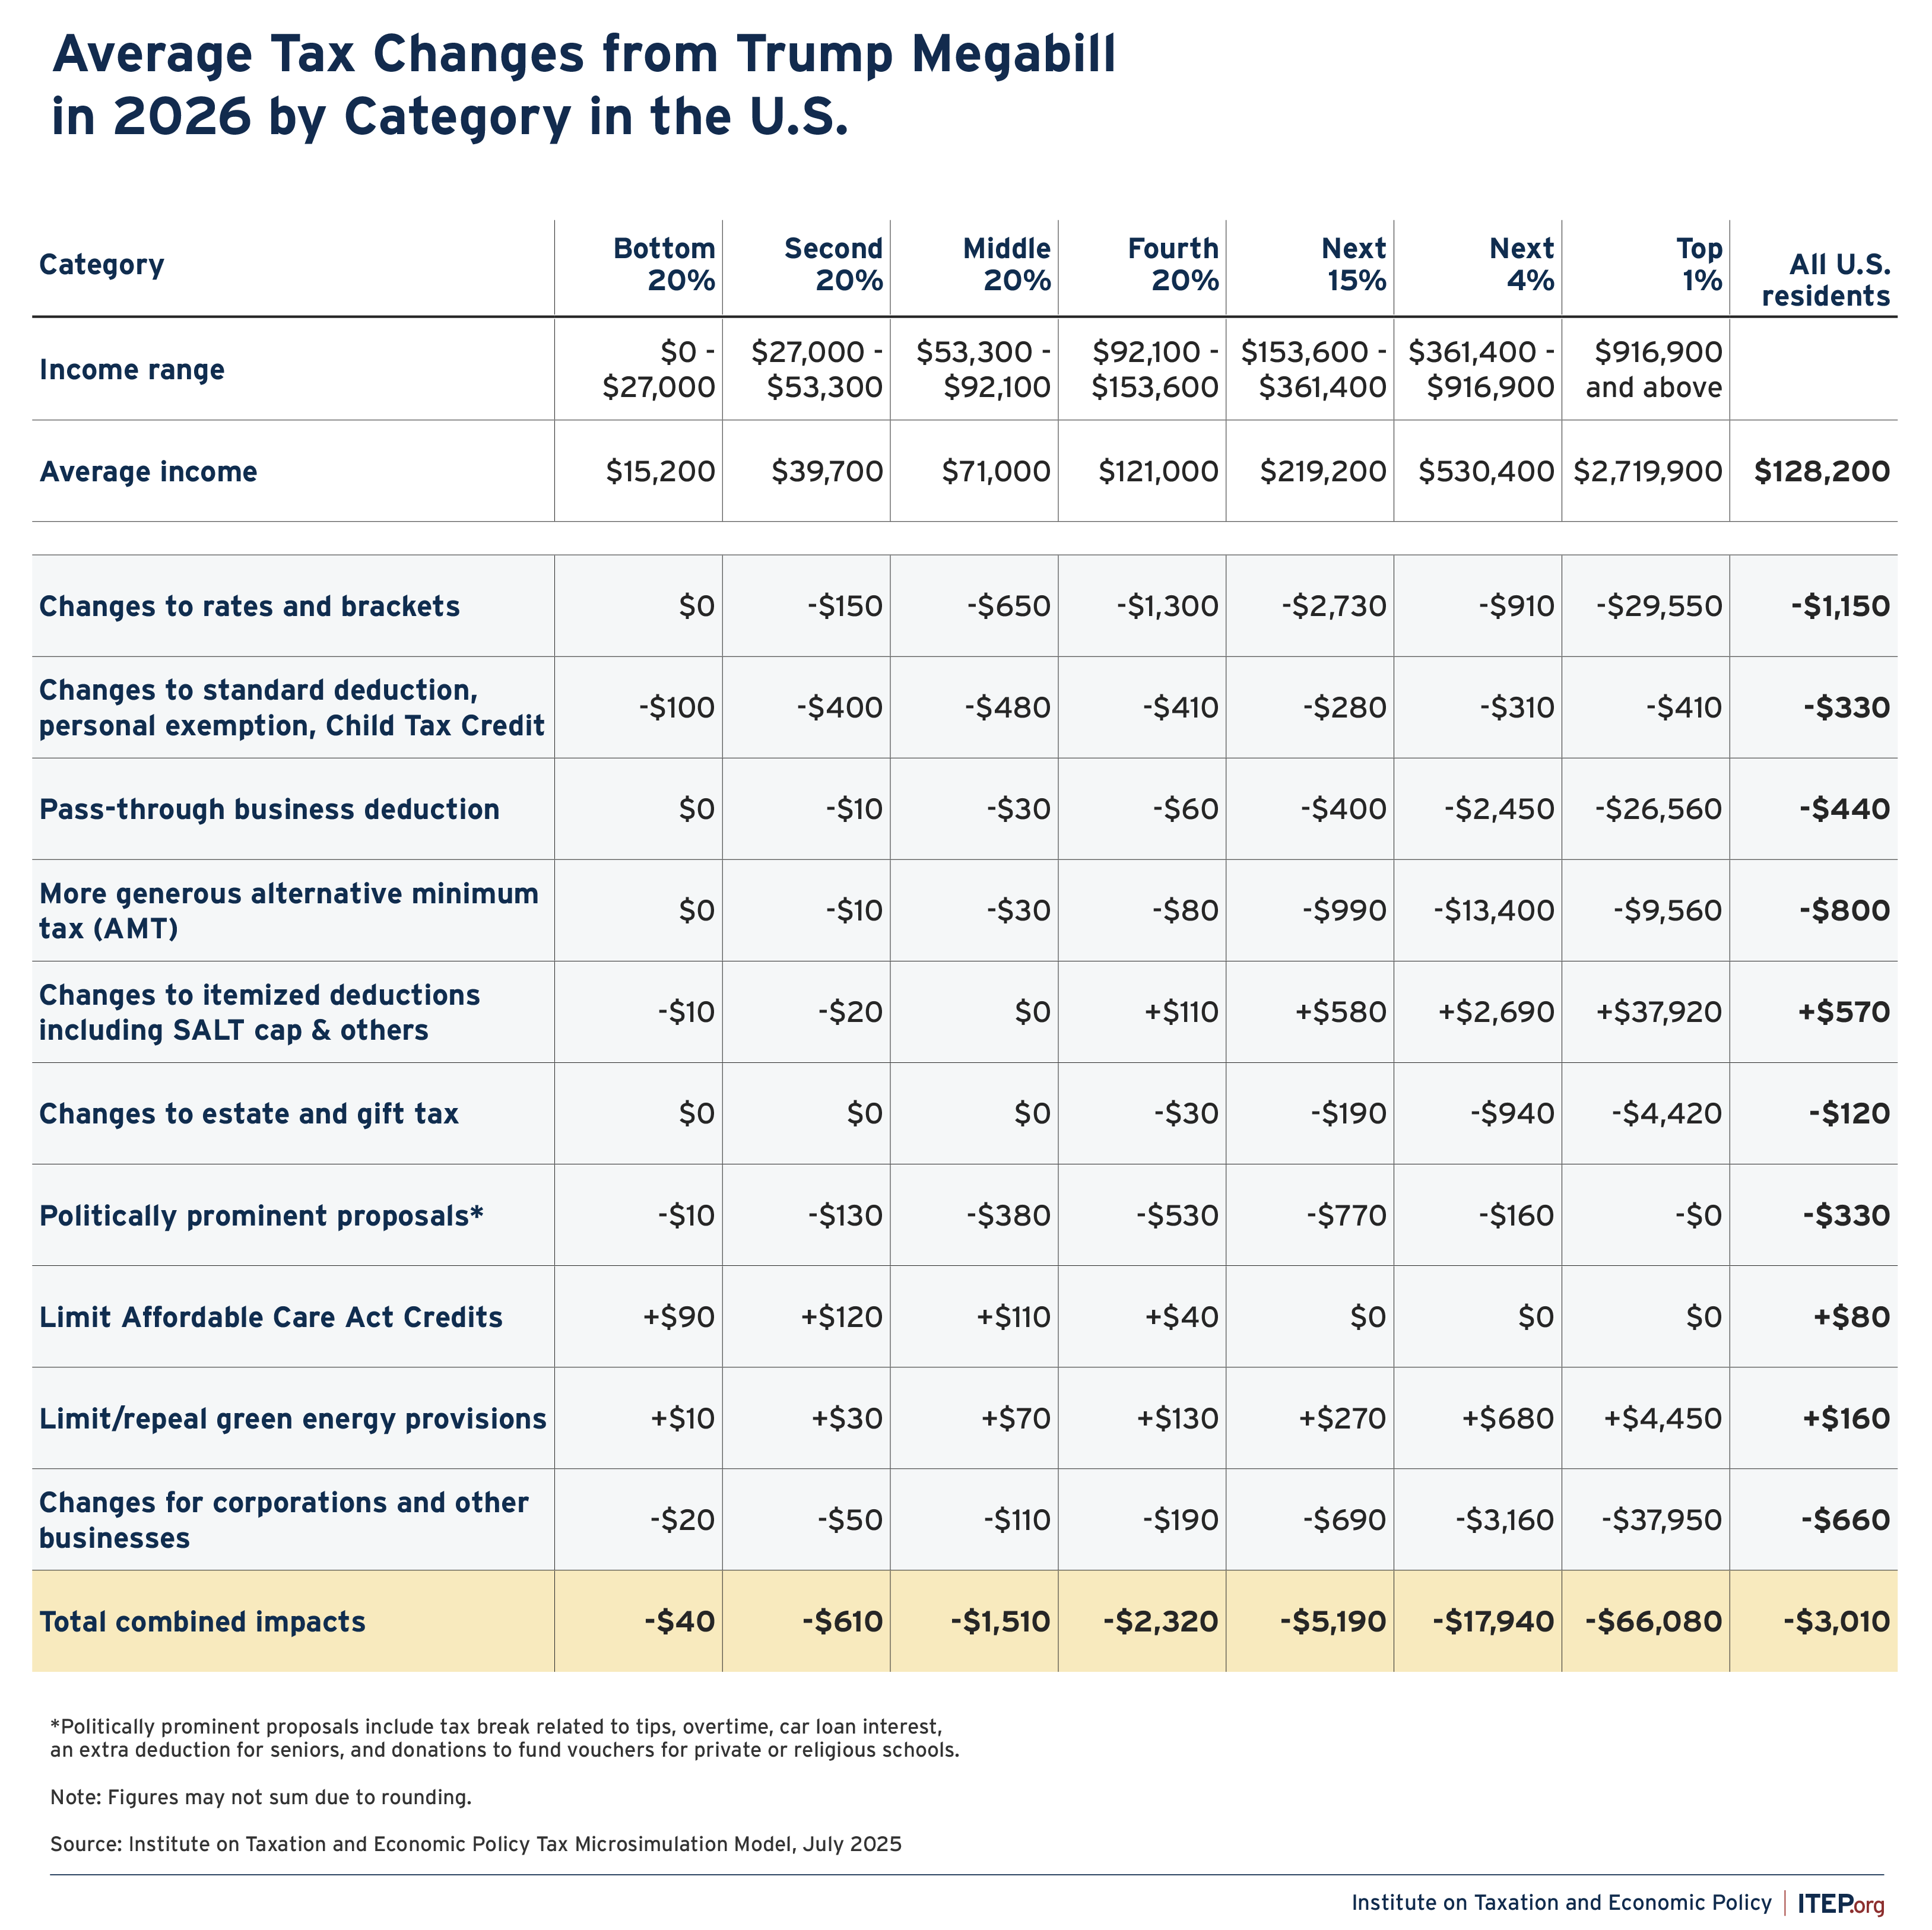
FIGURE 8
Revenue Impact of Tax Provisions Included in this Analysis of the Trump Megabill in 2026
| Provisions | Revenue Impact |
|---|---|
| Extending and Modifying TCJA Provisions Expiring End of 2025 and Related Changes | |
| Rates and Brackets | —$204 billion |
| Standard Deduction | —$117 billion |
| Personal Exemptions | +$147 billion |
| Child Tax Credit | —$89 billion |
| Pass-Through Deduction | —$79 billion |
| Alternative Minimum Tax | —$142 billion |
| Itemized Deductions | +$103 billion |
| Estate Tax | —$20 billion |
| Total TCJA Provisions Expiring End of 2025 | —$402 billion |
| New Provisions Proposed as Middle-Class Tax Cuts | |
| Deduction for Tips | —$10 billion |
| Deduction for Overtime Pay | —$23 billion |
| Enhanced Deduction for Seniors | —$20 billion |
| Exclusion for Car Loan Interest | —$6 billion |
| Total New Provisions Proposed as Middle-Class Tax Cuts | —$58 billion |
| Business Tax Breaks (excluding pass-through deduction in TCJA) | |
| Reinstate bonus depreciation | —$65 billion |
| Reinstate research expensing | —$20 billion |
| Reinstate more generous limits on deductions for interest | —$6 billion |
| New international corporate rules | —$19 billion |
| Special depreciation allowance for qualified production property | —$34 billion |
| Section 179 small business expensing expanded | —$4 billion |
| Extension and modification of clean fuel production credit | —$2 billion |
| Extend and modify opportunity zones | —$8 billion |
| Expand advanced manufacturing investment credit | —$3 billion |
| Capital gains from farmland | —$3 billion |
| Total Business Tax Breaks | —$165 billion |
| Other Tax Provisions | |
| Repeal and phase out green tax provisions | +$37 billion |
| Limits on ACA credits | +$14 billion |
| Strengthen limit on deductions for high compensation | +$1 billion |
| 1 percent floor on corporate charitable deductions | +$2 billion |
| Treatment of payments from partnerships to partners for property or services | +$2 billion |
| Total Other Tax Provisions | +$56 billion |
| TOTAL | —$568 billion |
|
ITEP.org
 |
|
How Individuals and Families Will Experience the Megabill’s Tax Changes
This report has, so far, described the impacts of the megabill compared to what would happen if Congress did nothing (in other words, compared to what was current law). If Congress had done nothing, many tax breaks enacted previously would have expired at the end of this year, which means extending any of those tax breaks reduces revenue. This is the most sensible way to think about the fiscal impacts of tax legislation.
But individuals and families may want to know how the megabill will change their taxes next year compared to what they have been paying under the tax rules they have become accustomed to in recent years, which is a different question.
The latter approach, which compares the megabill to what was “current policy,” reveals that the megabill will increase taxes for working-class households in 2026 and will provide very small tax cuts to other middle-class households. And either approach (comparing the megabill to either current law or current policy) demonstrates that the megabill provides much larger tax cuts to wealthy Americans and foreign investors.
Fiscal Impacts Are Best Understood by Comparing To (What Was) Current Law
The megabill’s fiscal effects, or its cost, are simply the difference between the federal budget before and after it was enacted. This is another way of saying the megabill’s fiscal impacts are best understood by comparing the megabill to what was (before its enactment) current law.
Distributional Impacts Can Be Understood By Comparing To (What Was) Current Policy
Individuals and families may experience the megabill’s effects differently. Of the many tax provisions in effect this year, very few of us keep track of which are temporary and scheduled to expire at the end of this year. If someone wonders how the megabill will change their taxes compared to what they are paying now, they are asking how the megabill compares to a scenario in which temporary tax provisions have already been extended. This question can be answered by comparing the megabill to what was (before its enactment) current policy.
How The Two Ways of Understanding the Tax Changes Relate To Each Other
When lawmakers talk about the effects of tax legislation compared to current law, they are comparing the legislation to what would happen if they did nothing. If there are temporary tax provisions that are scheduled to expire, their expiration would have no impact at all because they are part of the law that Congress already debated and enacted.
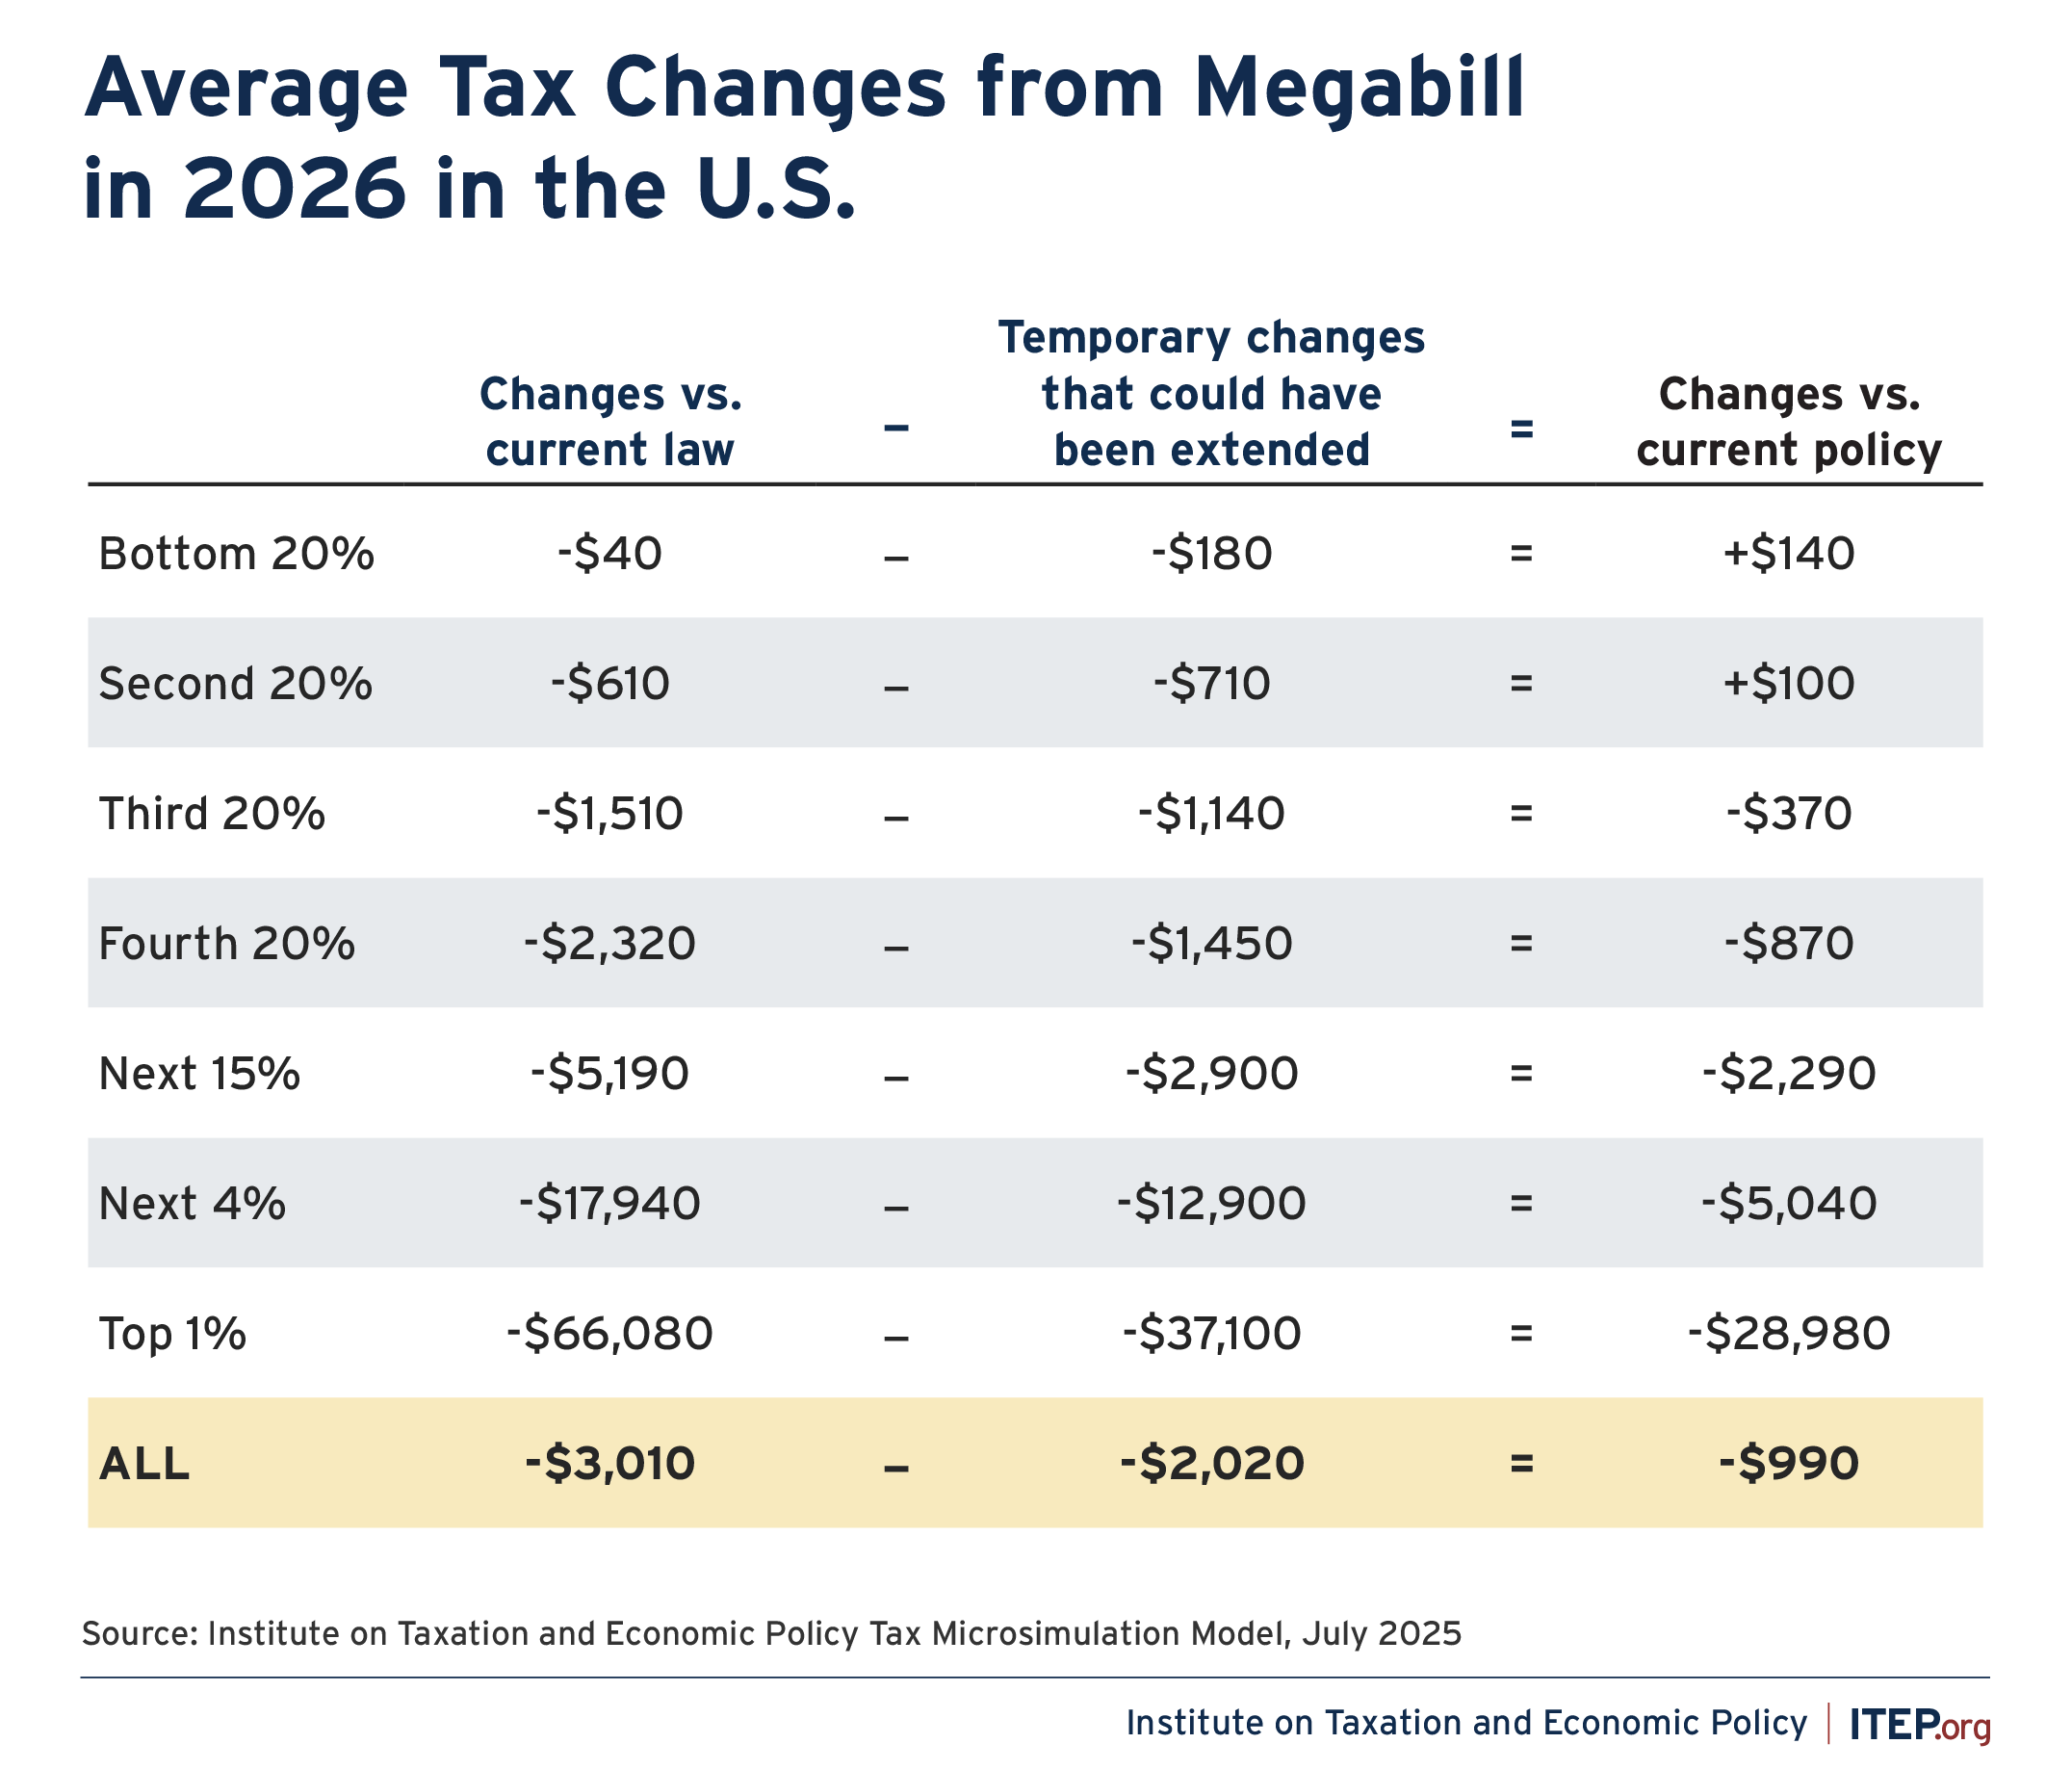
When lawmakers talk about the effects of tax legislation compared to current policy, what they are really doing is describing the effects compared to current law but subtracting out the effects of extending any temporary tax provisions that were in effect at the time, as illustrated in Figure 9 below.
For example, compared to current law (Congress doing nothing) the megabill will cut taxes for the poorest fifth of Americans by an average of $40 in 2026. But if Congress had simply extended the temporary tax provisions in effect and scheduled to expire at the end of 2025, that would cut taxes for the poorest fifth of Americans by an average of $180 compared to current law in 2026. This means that, compared to the “current policy,” the megabill will raise taxes for the poorest fifth of Americans by $140 next year.
FIGURE 9
Compared to current policy, any extensions of existing temporary tax breaks are not a change that should be quantified. The megabill extends the tax cuts first enacted in 2017, but this is not a change from current policy.
Compared to current policy, any expiration of existing temporary tax breaks is a tax increase. The megabill does not extend a temporary expansion of health care tax credits enacted during the Biden administration, which individuals and families will experience as a tax increase next year compared to what they paid this year.
As shown in Figure 9 above, the decision of the law’s drafters to not extend the expansion of health care tax credits will be particularly consequential for the bottom two-fifths of Americans next year, who face an average tax increase compared to current policy as a result.
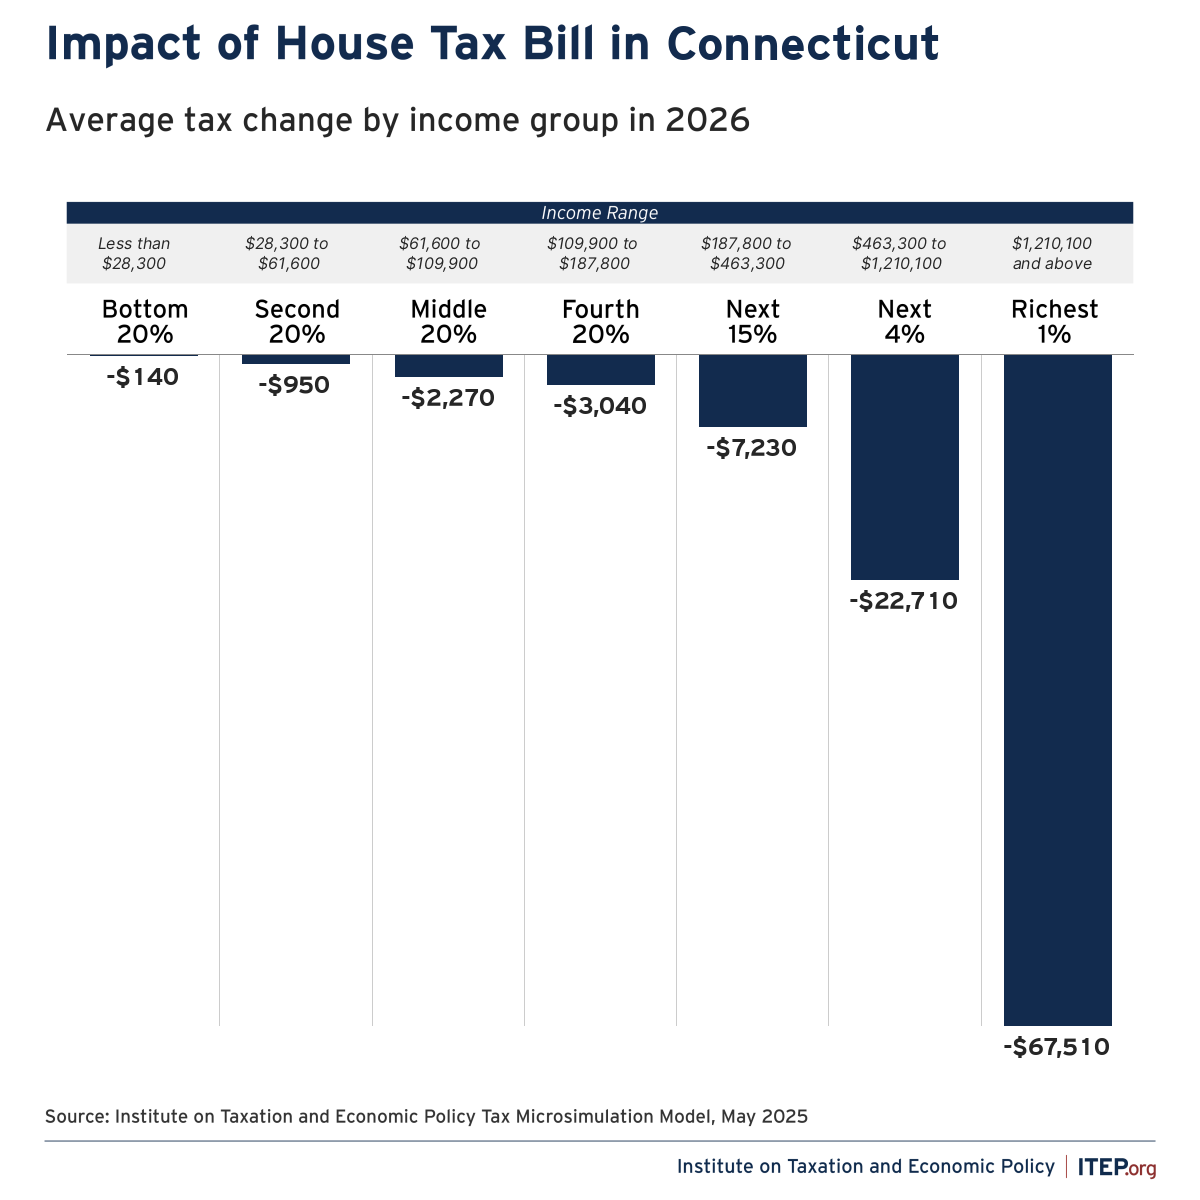
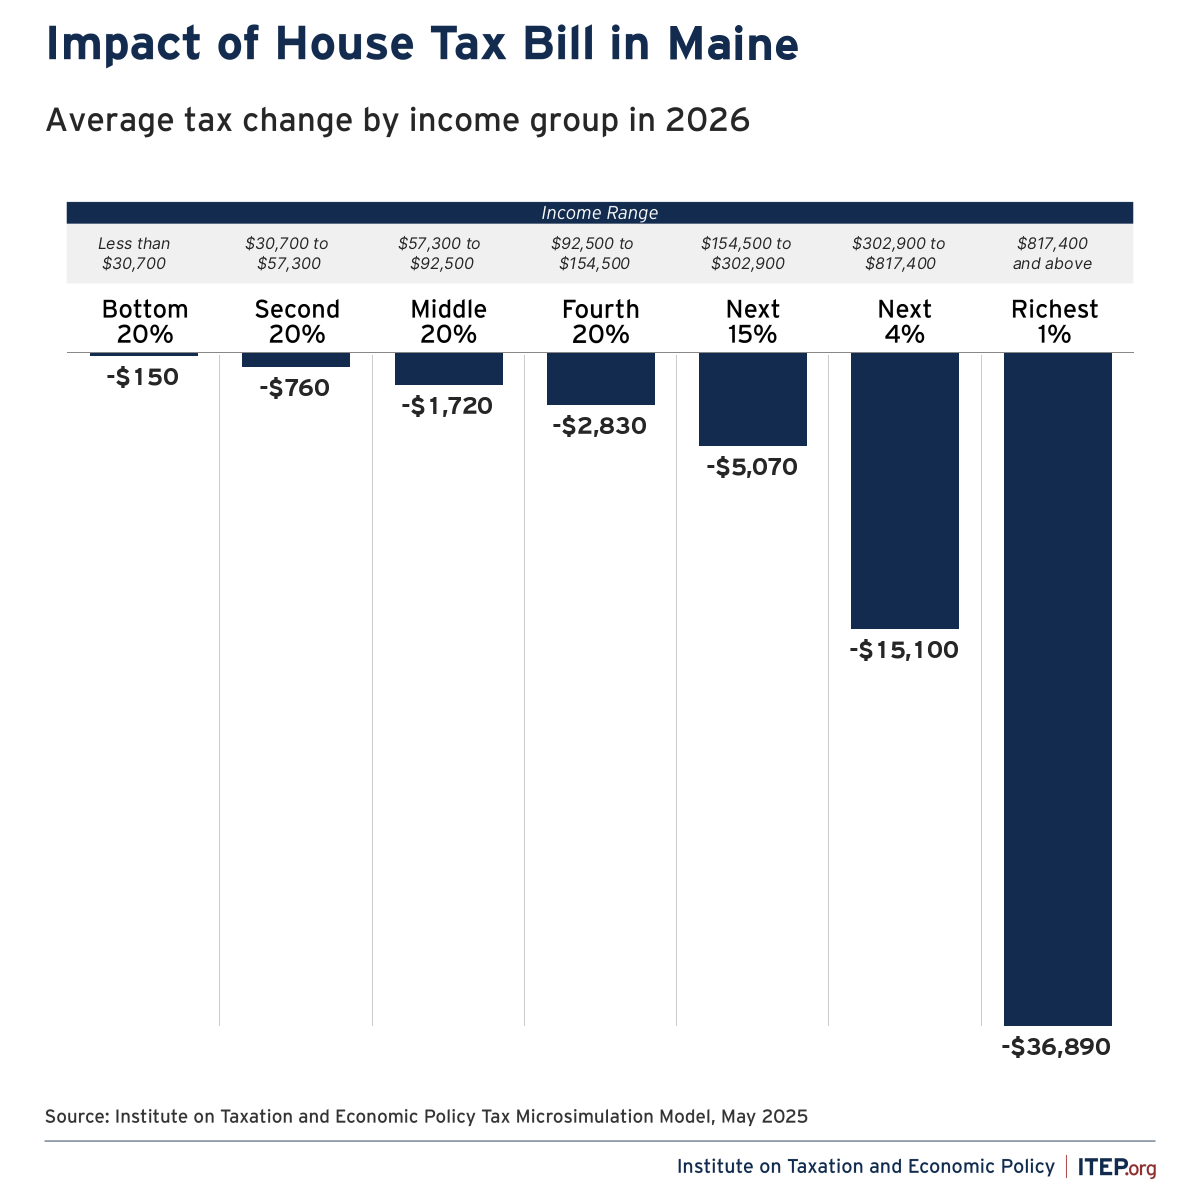
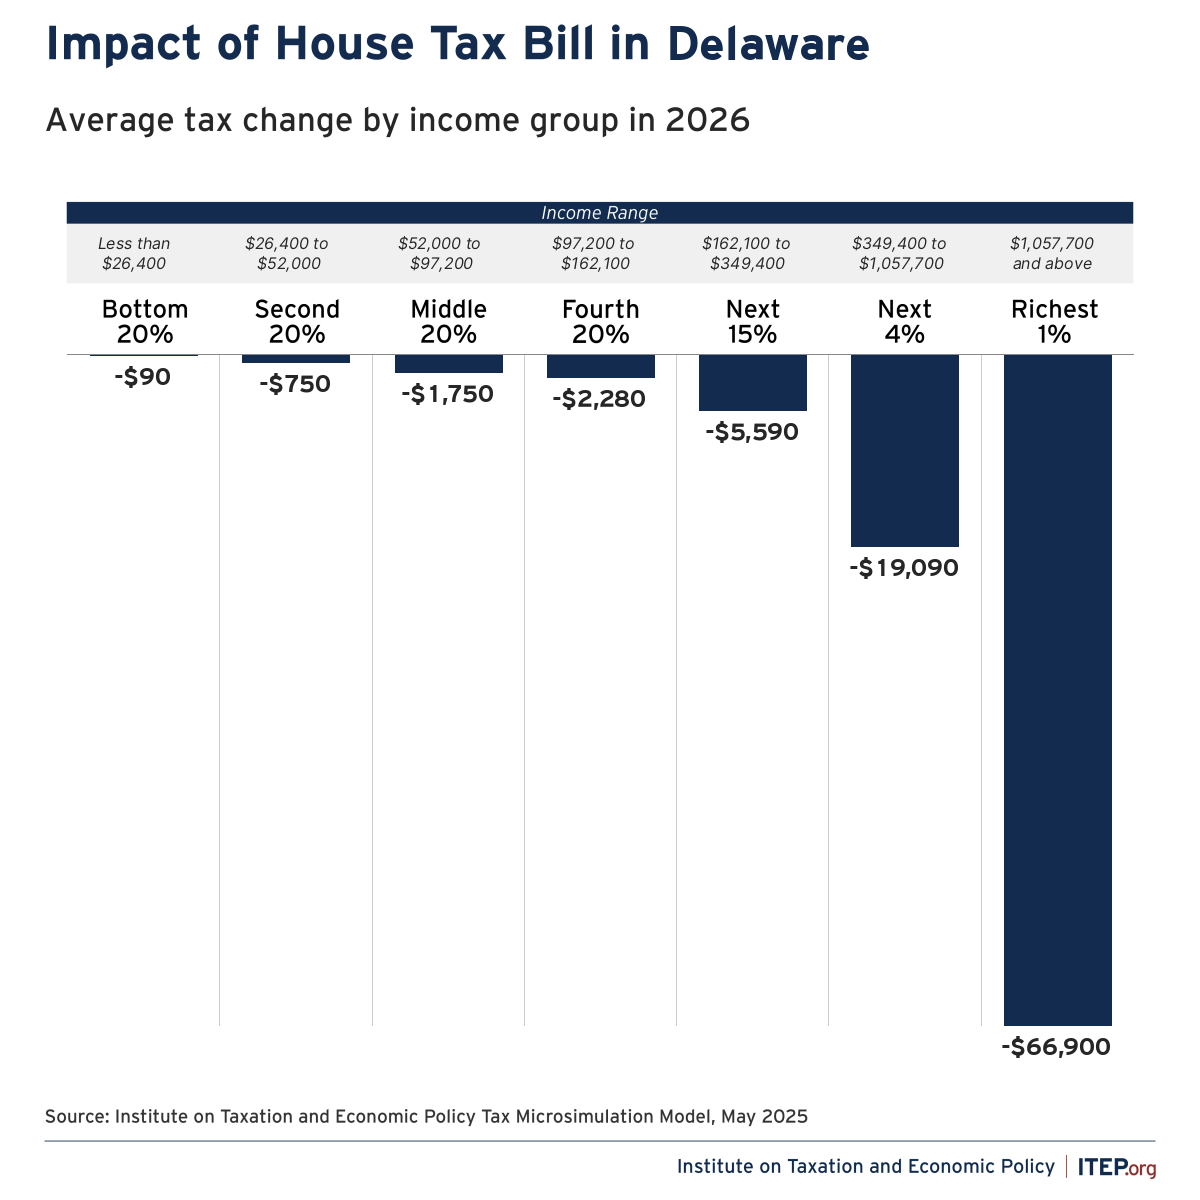
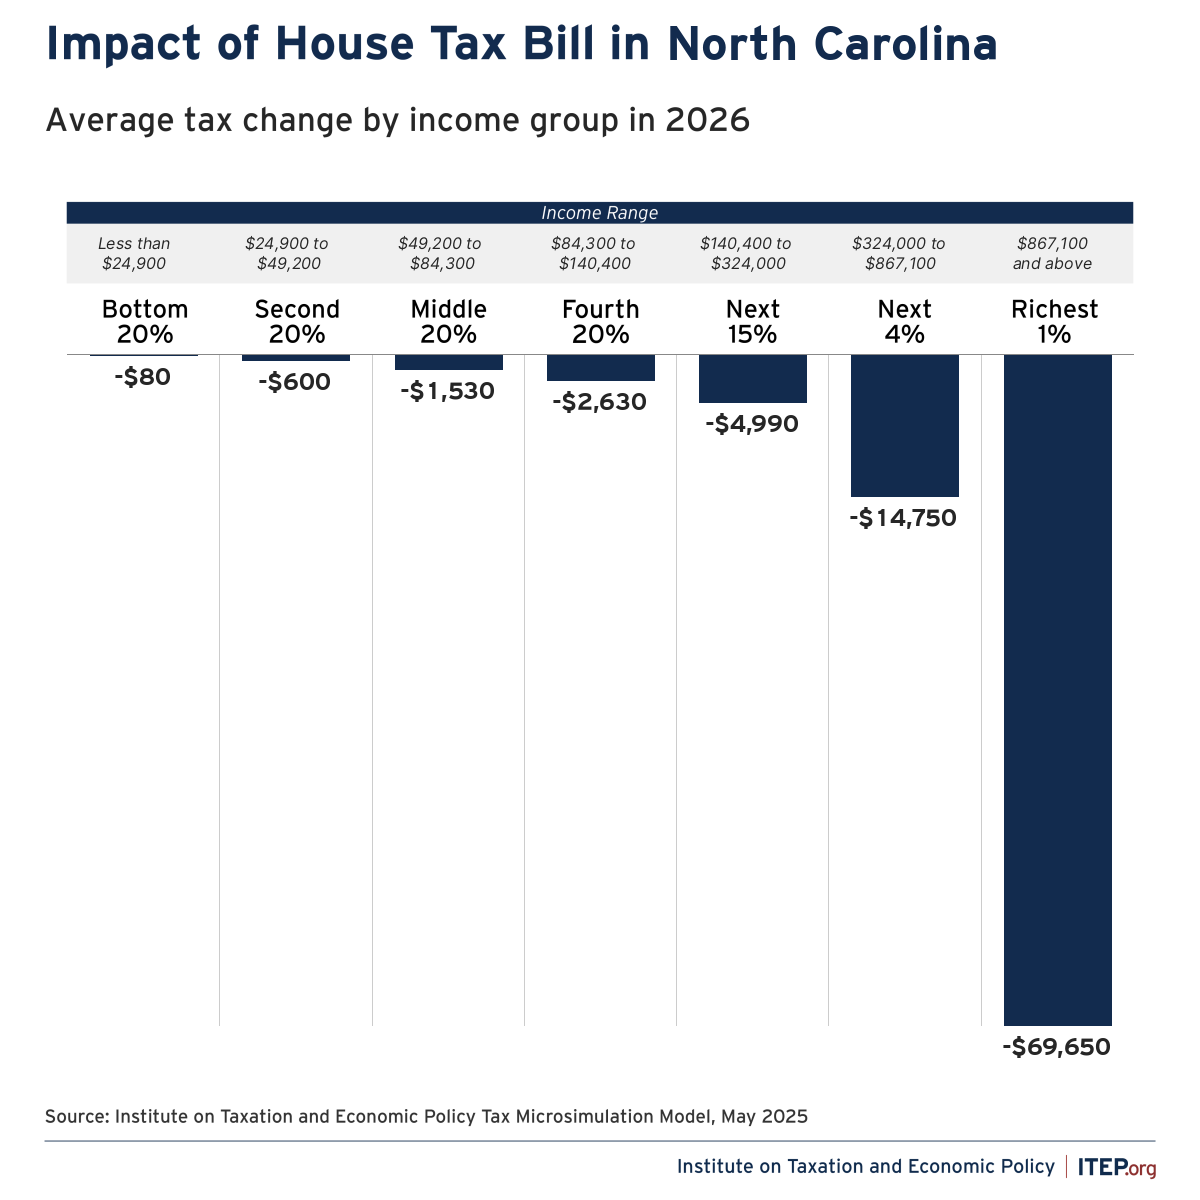
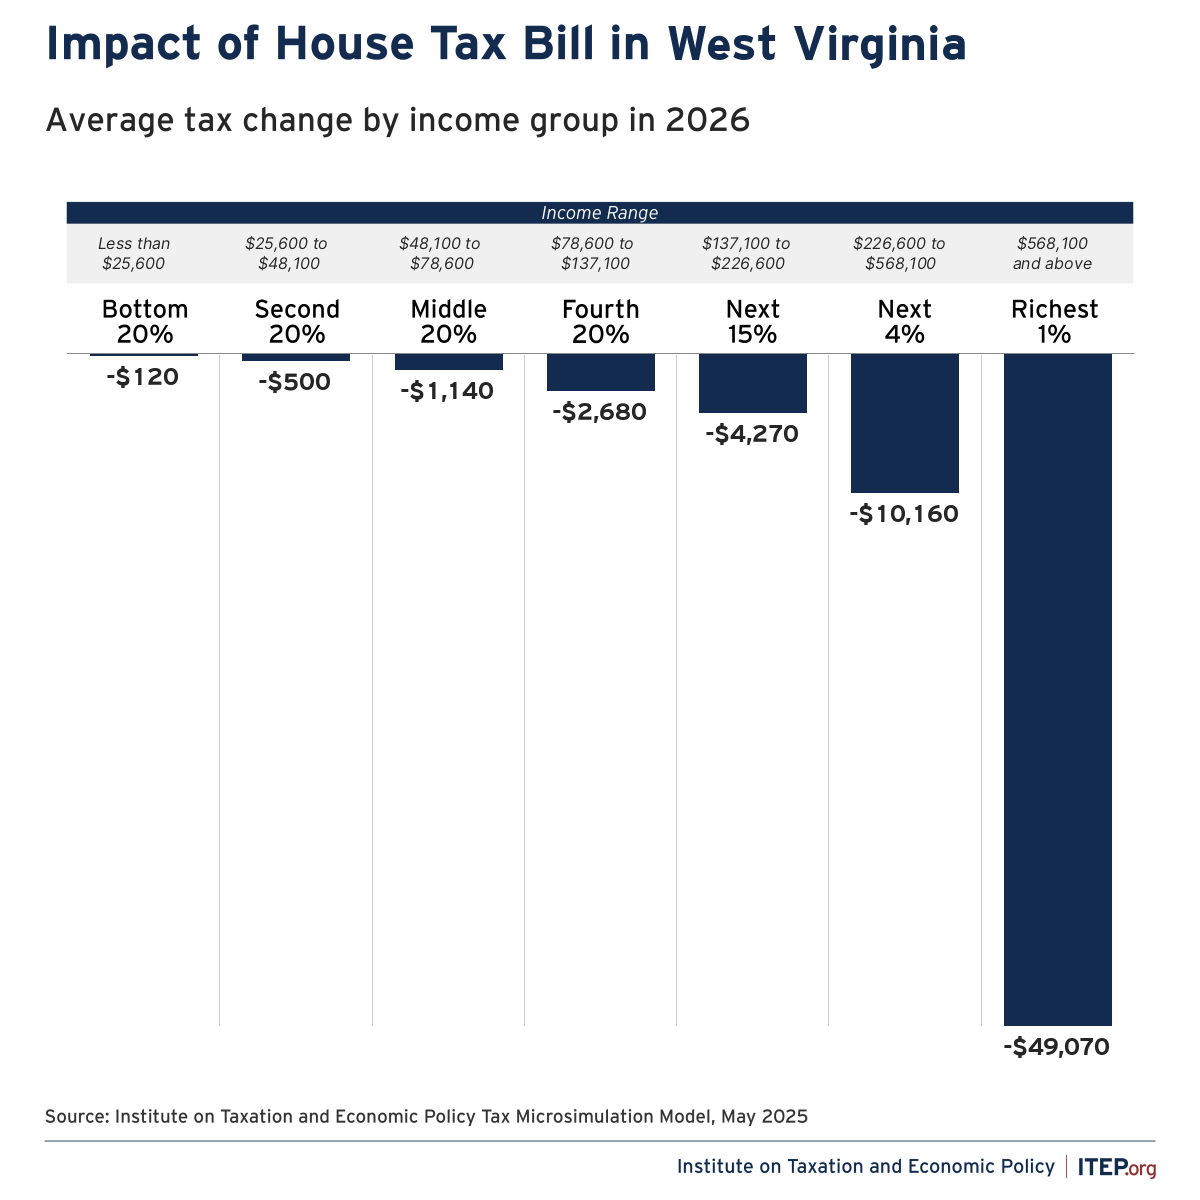
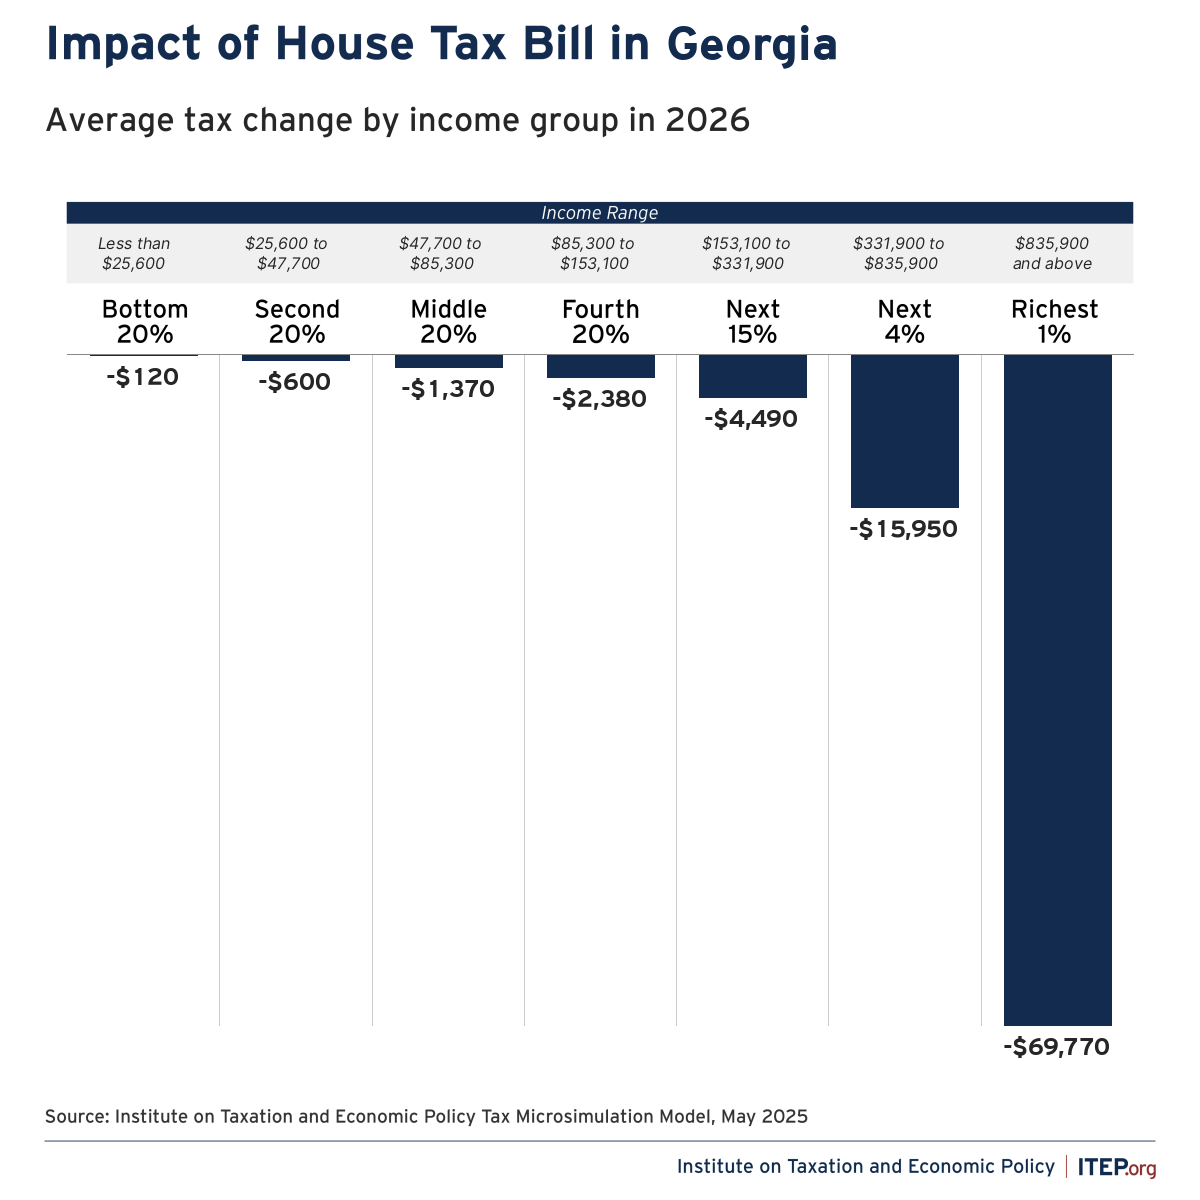
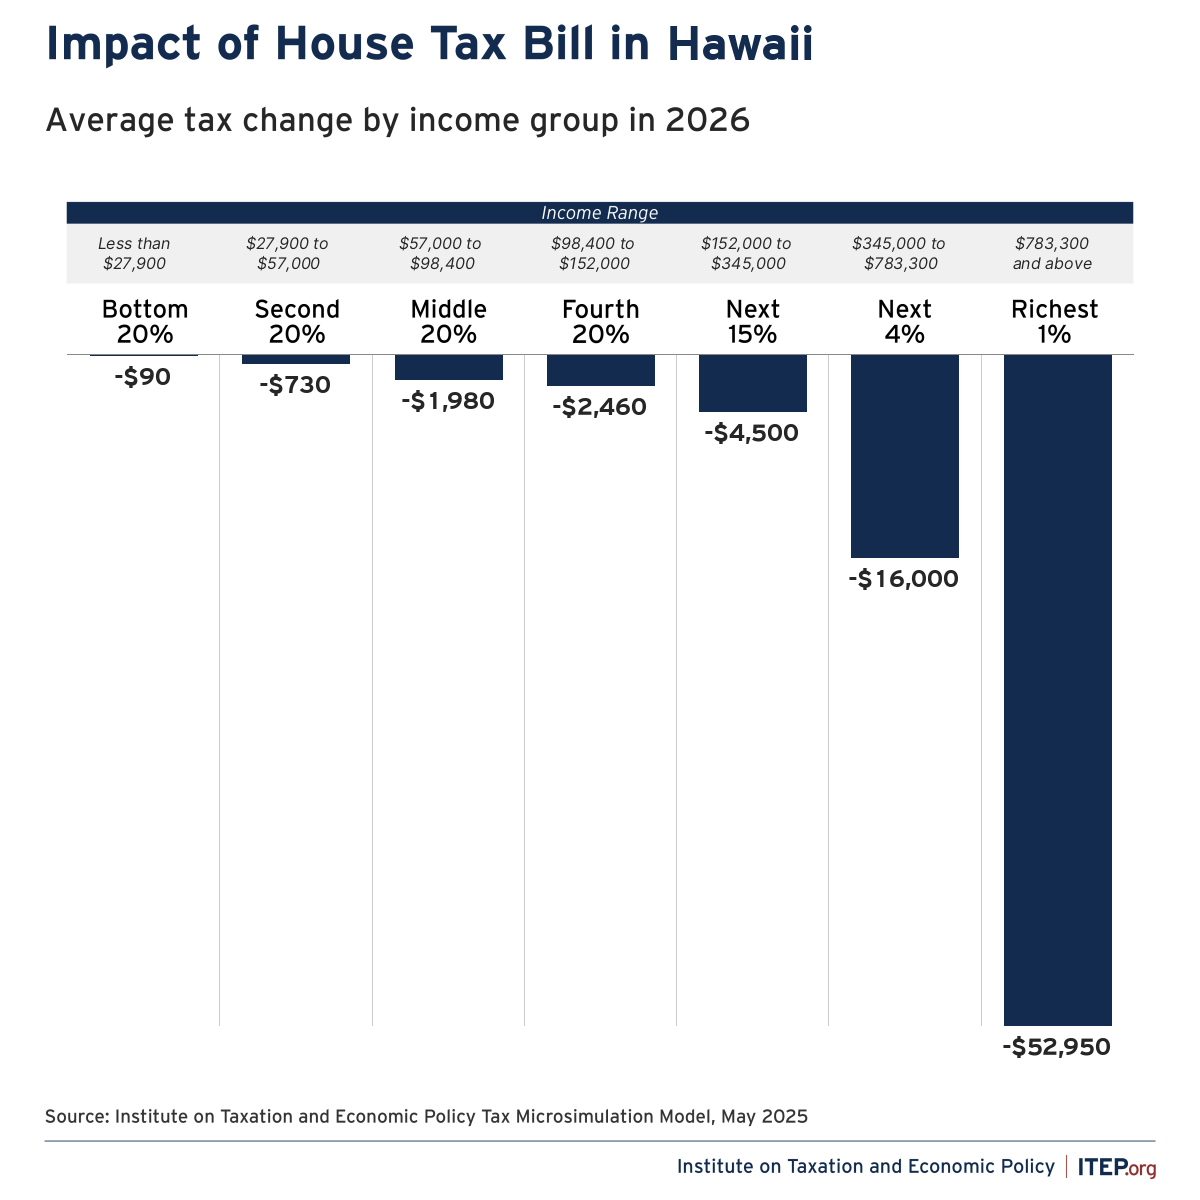
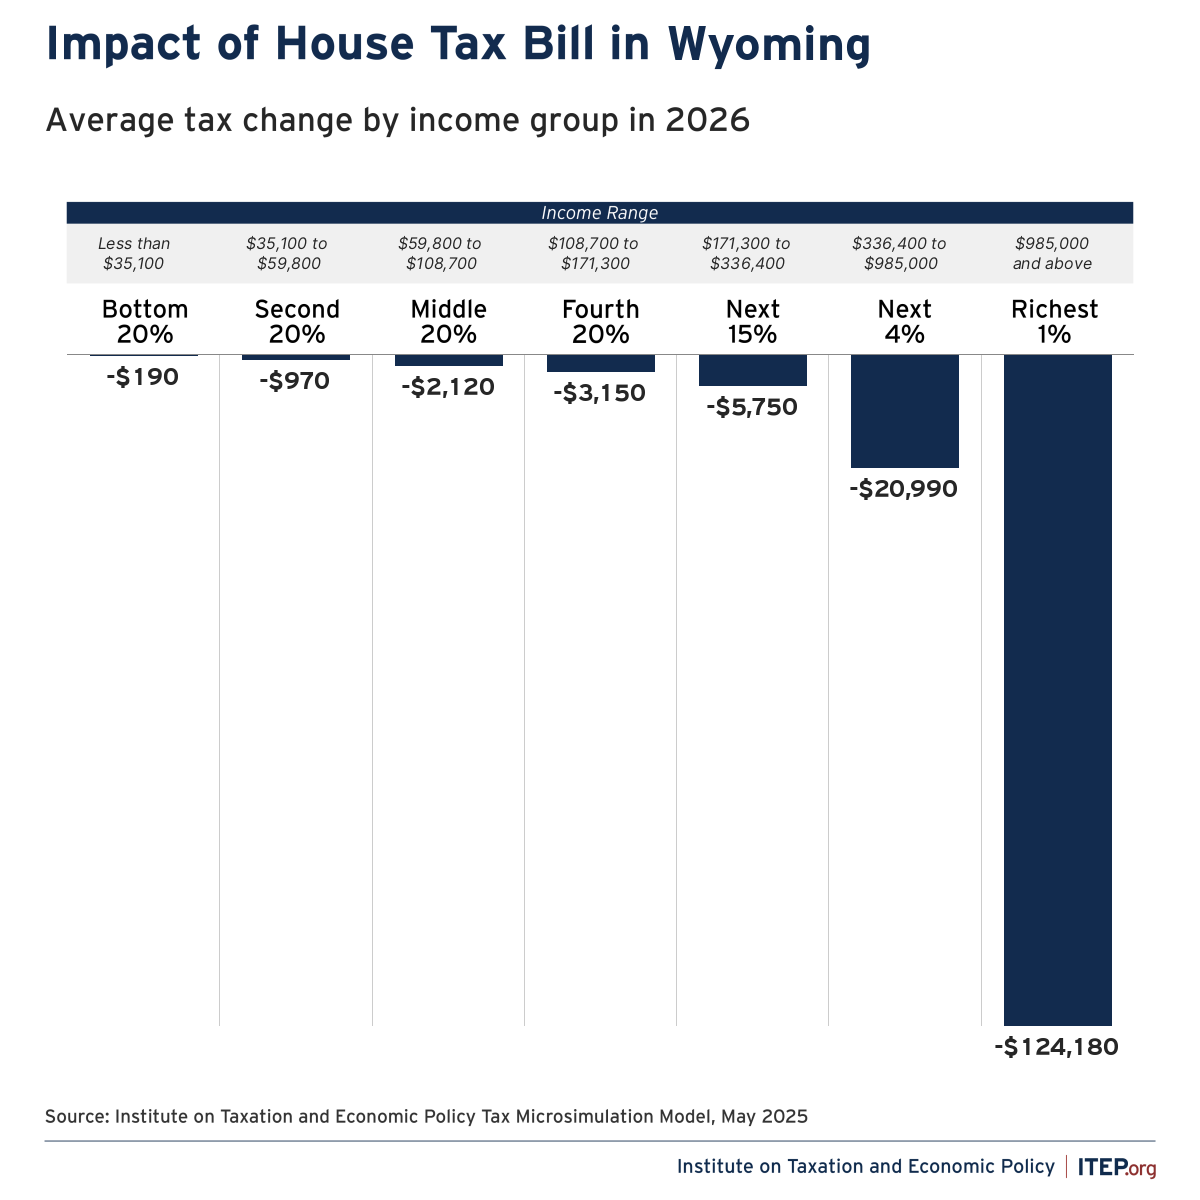
State-by-State Data
Download national and state-by-state estimates


